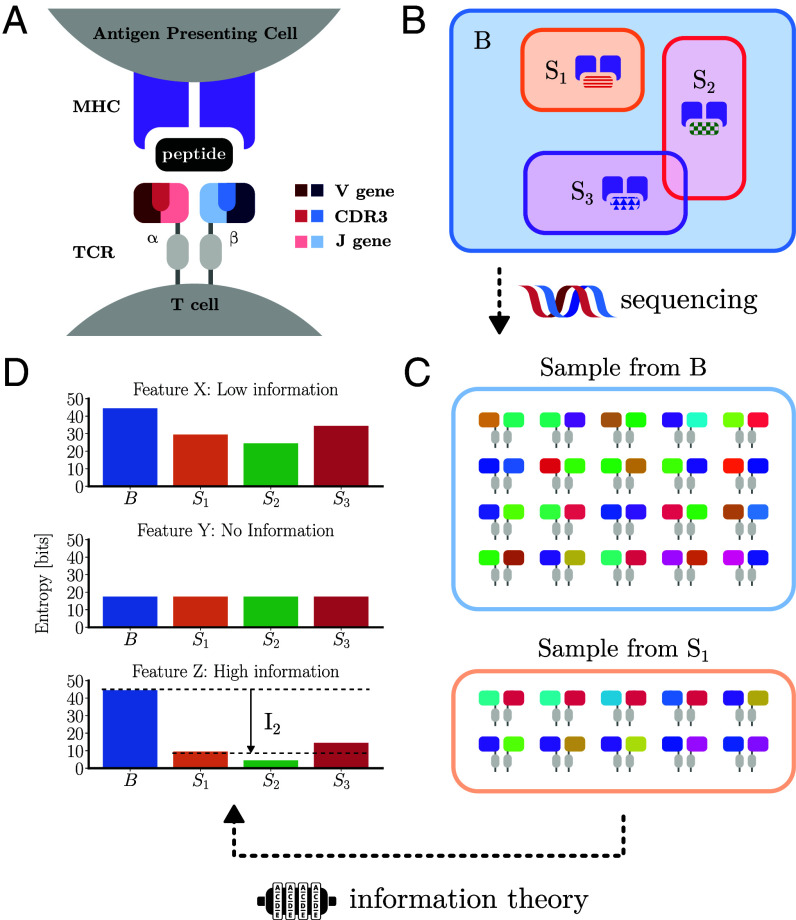
Fig. 1.
Overview of analysis methodology. (A) Sketch of T cell receptor structure highlighting the V, CDR3, and J regions and their interaction with MHC-bound peptides. The TCR is composed of two chains, most commonly and chains. Each chain is generated by the process of V(D)J recombination during T cell development, which combines a V (variable), J (joining), and C (constant) gene, with the addition of a D (diversity) gene in the chain. Within each chain, the CDR1 and CDR2 amino acid loops are coded for by the V gene while the CDR3 regions are at the V(D)J intersection, which is additionally diversified through the random insertion and deletion of nucleotides at gene template junctions. (B) An abstracted view of TCR sequence space. The set B includes all possible TCRs. The subsets Si represent TCRs specific to particular ligands. (C) Sequencing TCR from either the whole repertoire or epitope-specific subsets gives us samples from their respective distributions. (D) The number of pairs which match in a particular feature may then be recorded to compute a probability of coincidence. The logarithm of the probability of coincidence gives a measure of the entropy of the feature. Our information theoretic approach quantifies the change in entropy between background TCRs and sets of specific TCRs of different features (Top to Bottom). Features which experience a large reduction in entropy (Bottom) are the most informative for predicting the epitope specificity of a sequence.

