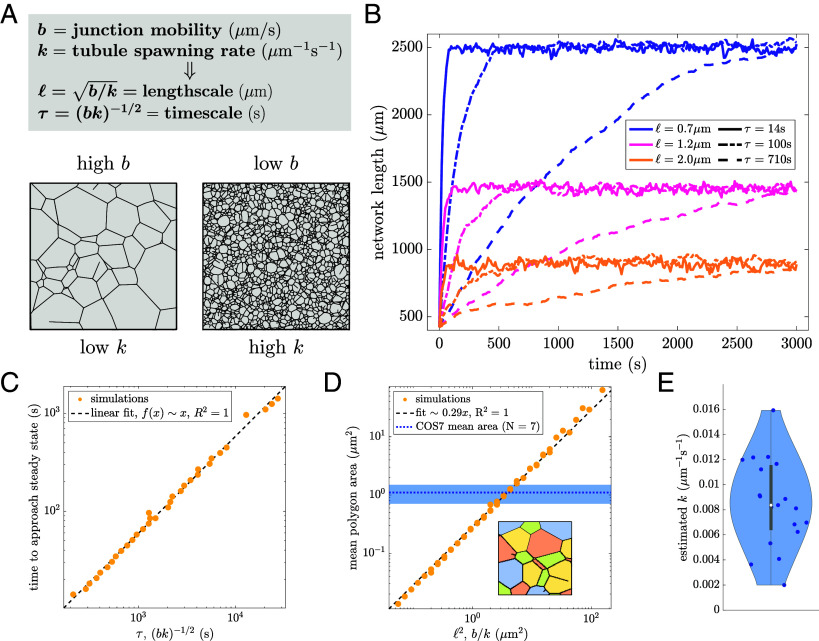
Fig. 2.
Steady-state network density and rearrangement timescales are set by two parameters. (A) Junction mobility and tubule spawning rate set the length and time scales (, respectively). (B) Network length over time for nine separate simulations, each starting from an initially sparse honeycomb network enclosed in a circle of radius m. The steady-state network length is set by (color) and the time to reach steady state is set by (line style). Other parameters are /s and m/s. (C) Timescale to approach steady state, extracted via exponential fit of curves as in (B) is proportional to the intrinsic network timescale . (D) The mean area of polygons in a liquid network is proportional to . Mean polygon area in COS7 cells is indicated by the dotted blue line; the shaded region gives intercell SD ( cells). Inset: illustration of polygon extraction, different colored regions correspond to individual polygons. (E) Measured spawning rates from 19 COS7 cells, with mean and intercell SD of . Scatter data for (C and D) is from simulations with mobility ranging between 0.001 to 0.1 and spawning rate ranging between 0.0005 to 0.05 .

