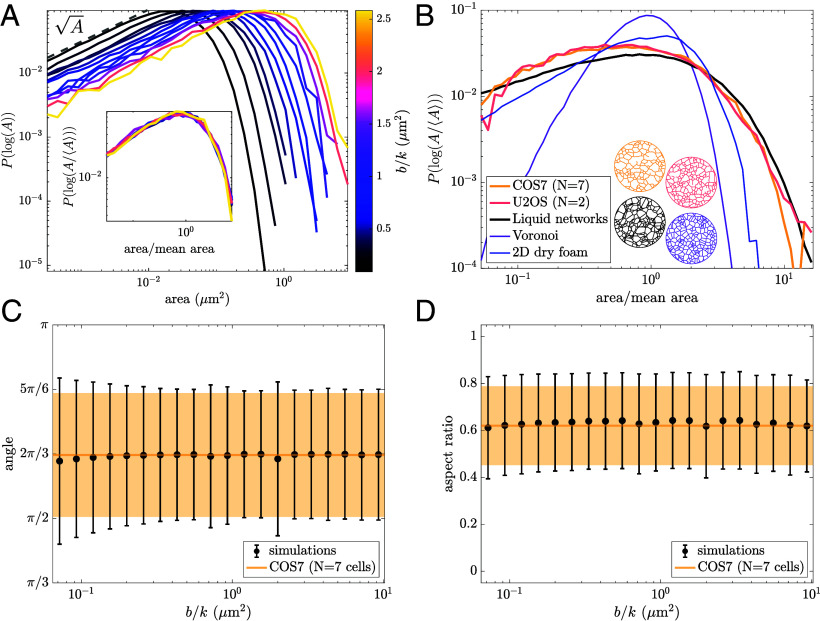
Fig. 3.
Scale-invariant liquid network model reproduces peripheral ER morphology. (A) Distribution of polygon areas in simulated liquid networks for a range of values. Bin sizes are logarithmic. Inset: distributions collapse onto a single curve when normalized by mean area, revealing scale-invariant behavior of liquid networks. (B) Distribution of normalized polygon areas from the ER networks of COS7 and U2OS cells (yellow and pink, respectively) exhibit similar scaling to simulated liquid networks (black). For comparison, the distribution of areas for Voronoi networks and experimental measurements of a two-dimensional dry foam (data from ref. 49) are also shown (purple and blue lines). Example networks in matching color Below. (C) Mean and SD of angles between 3-way junctions in liquid networks (black) and the COS7 ER (yellow). (D) Mean and SD of aspect ratio (shortest dimension/longest dimension) in liquid networks (black) and the COS7 ER (yellow).

