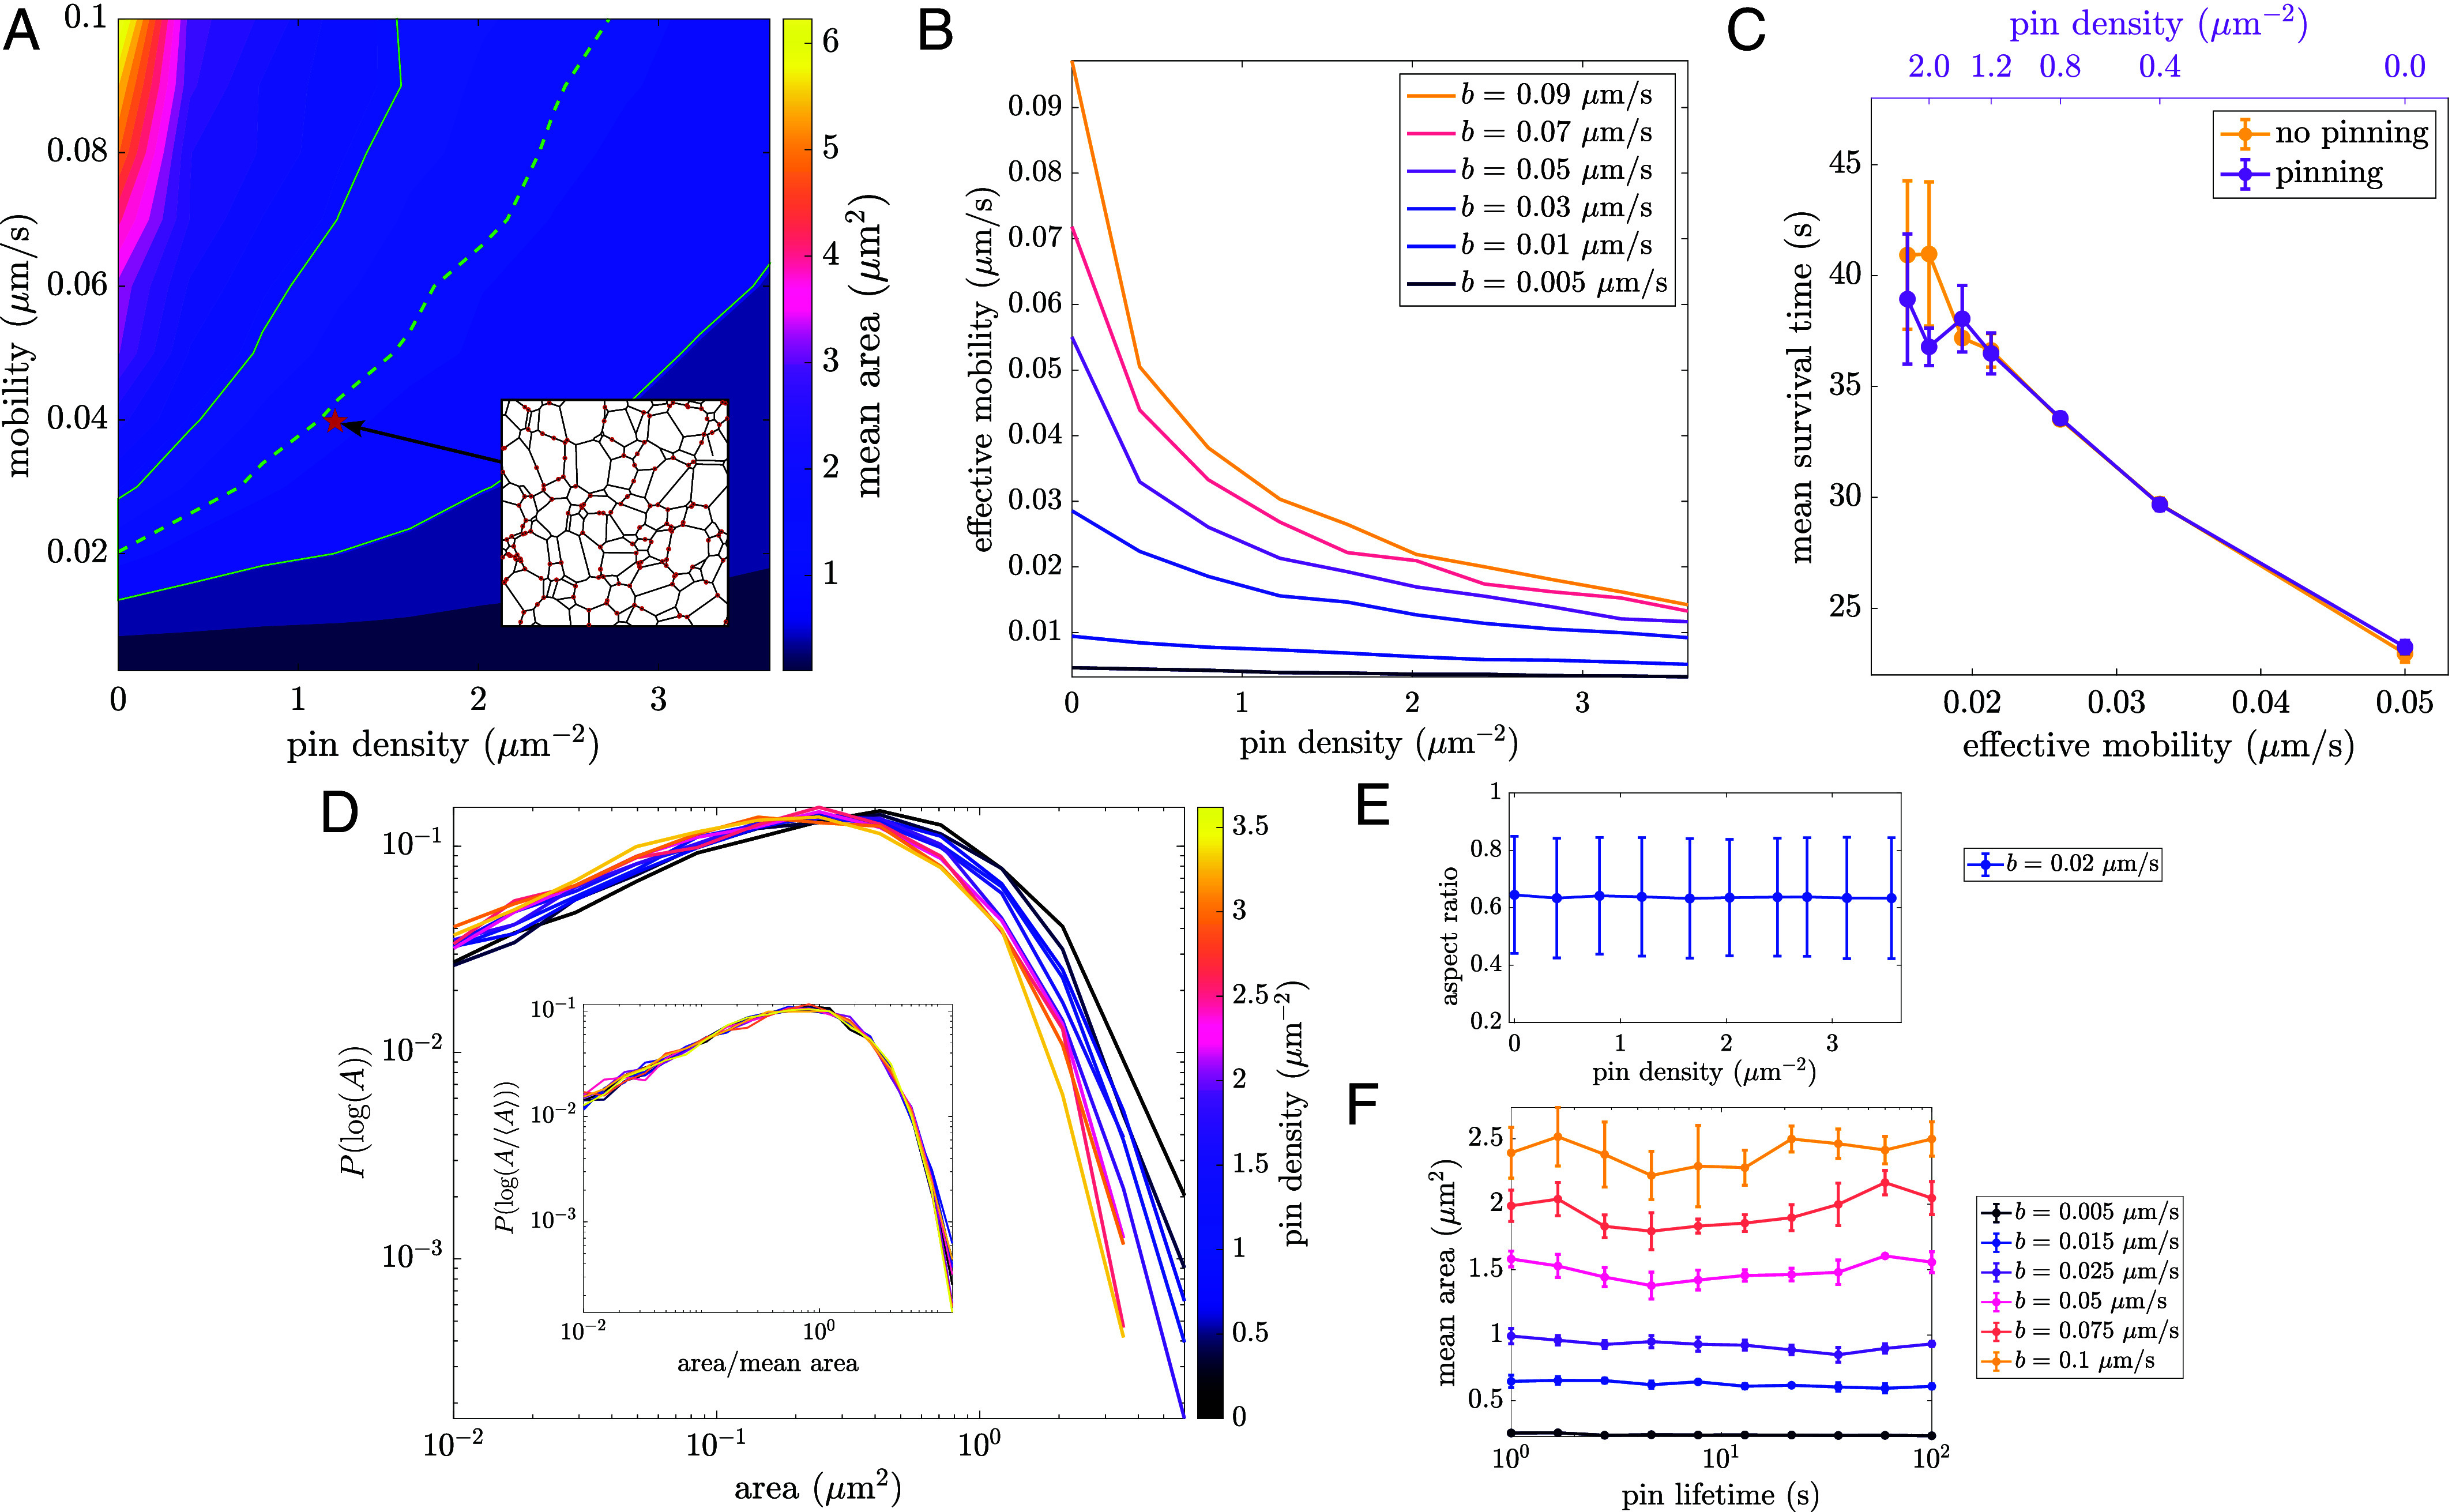
Fig. 5.

Tethering to static structures reduces effective mobility and increases network density. (A) Dependence of mean area on mobility and pin density. The dashed green line indicates contour corresponding to mean COS7 area, with the shaded green region indicating SD across all cells (). Inset: depicts an example msnapshot of a liquid network with pinned nodes highlighted in red. (B) Effective mobility, defined as , as a function of pin density for different mobilities. (C) Mean polygon survival time for simulations with and without pinning. Yellow curve: no pinning, varying junction mobility (Bottom axis). Pink curve: different pin densities (Top axis), with constant mobility m/s, plotted against the effective junction mobility (Bottom axis). Matching effective mobilities gives similar results with and without pinning. Error bars indicate SD across three simulations for each data point. (D) Reversible pinning leads to denser networks, shifting the area distributions. Inset: normalized area distributions collapse to a single curve for all pin densities. (E) Aspect ratio is unchanged across a range of pin densities. (F) Mean area remains constant across a wide range of pin lifetimes. All results are with a tubule spawning rate of .
