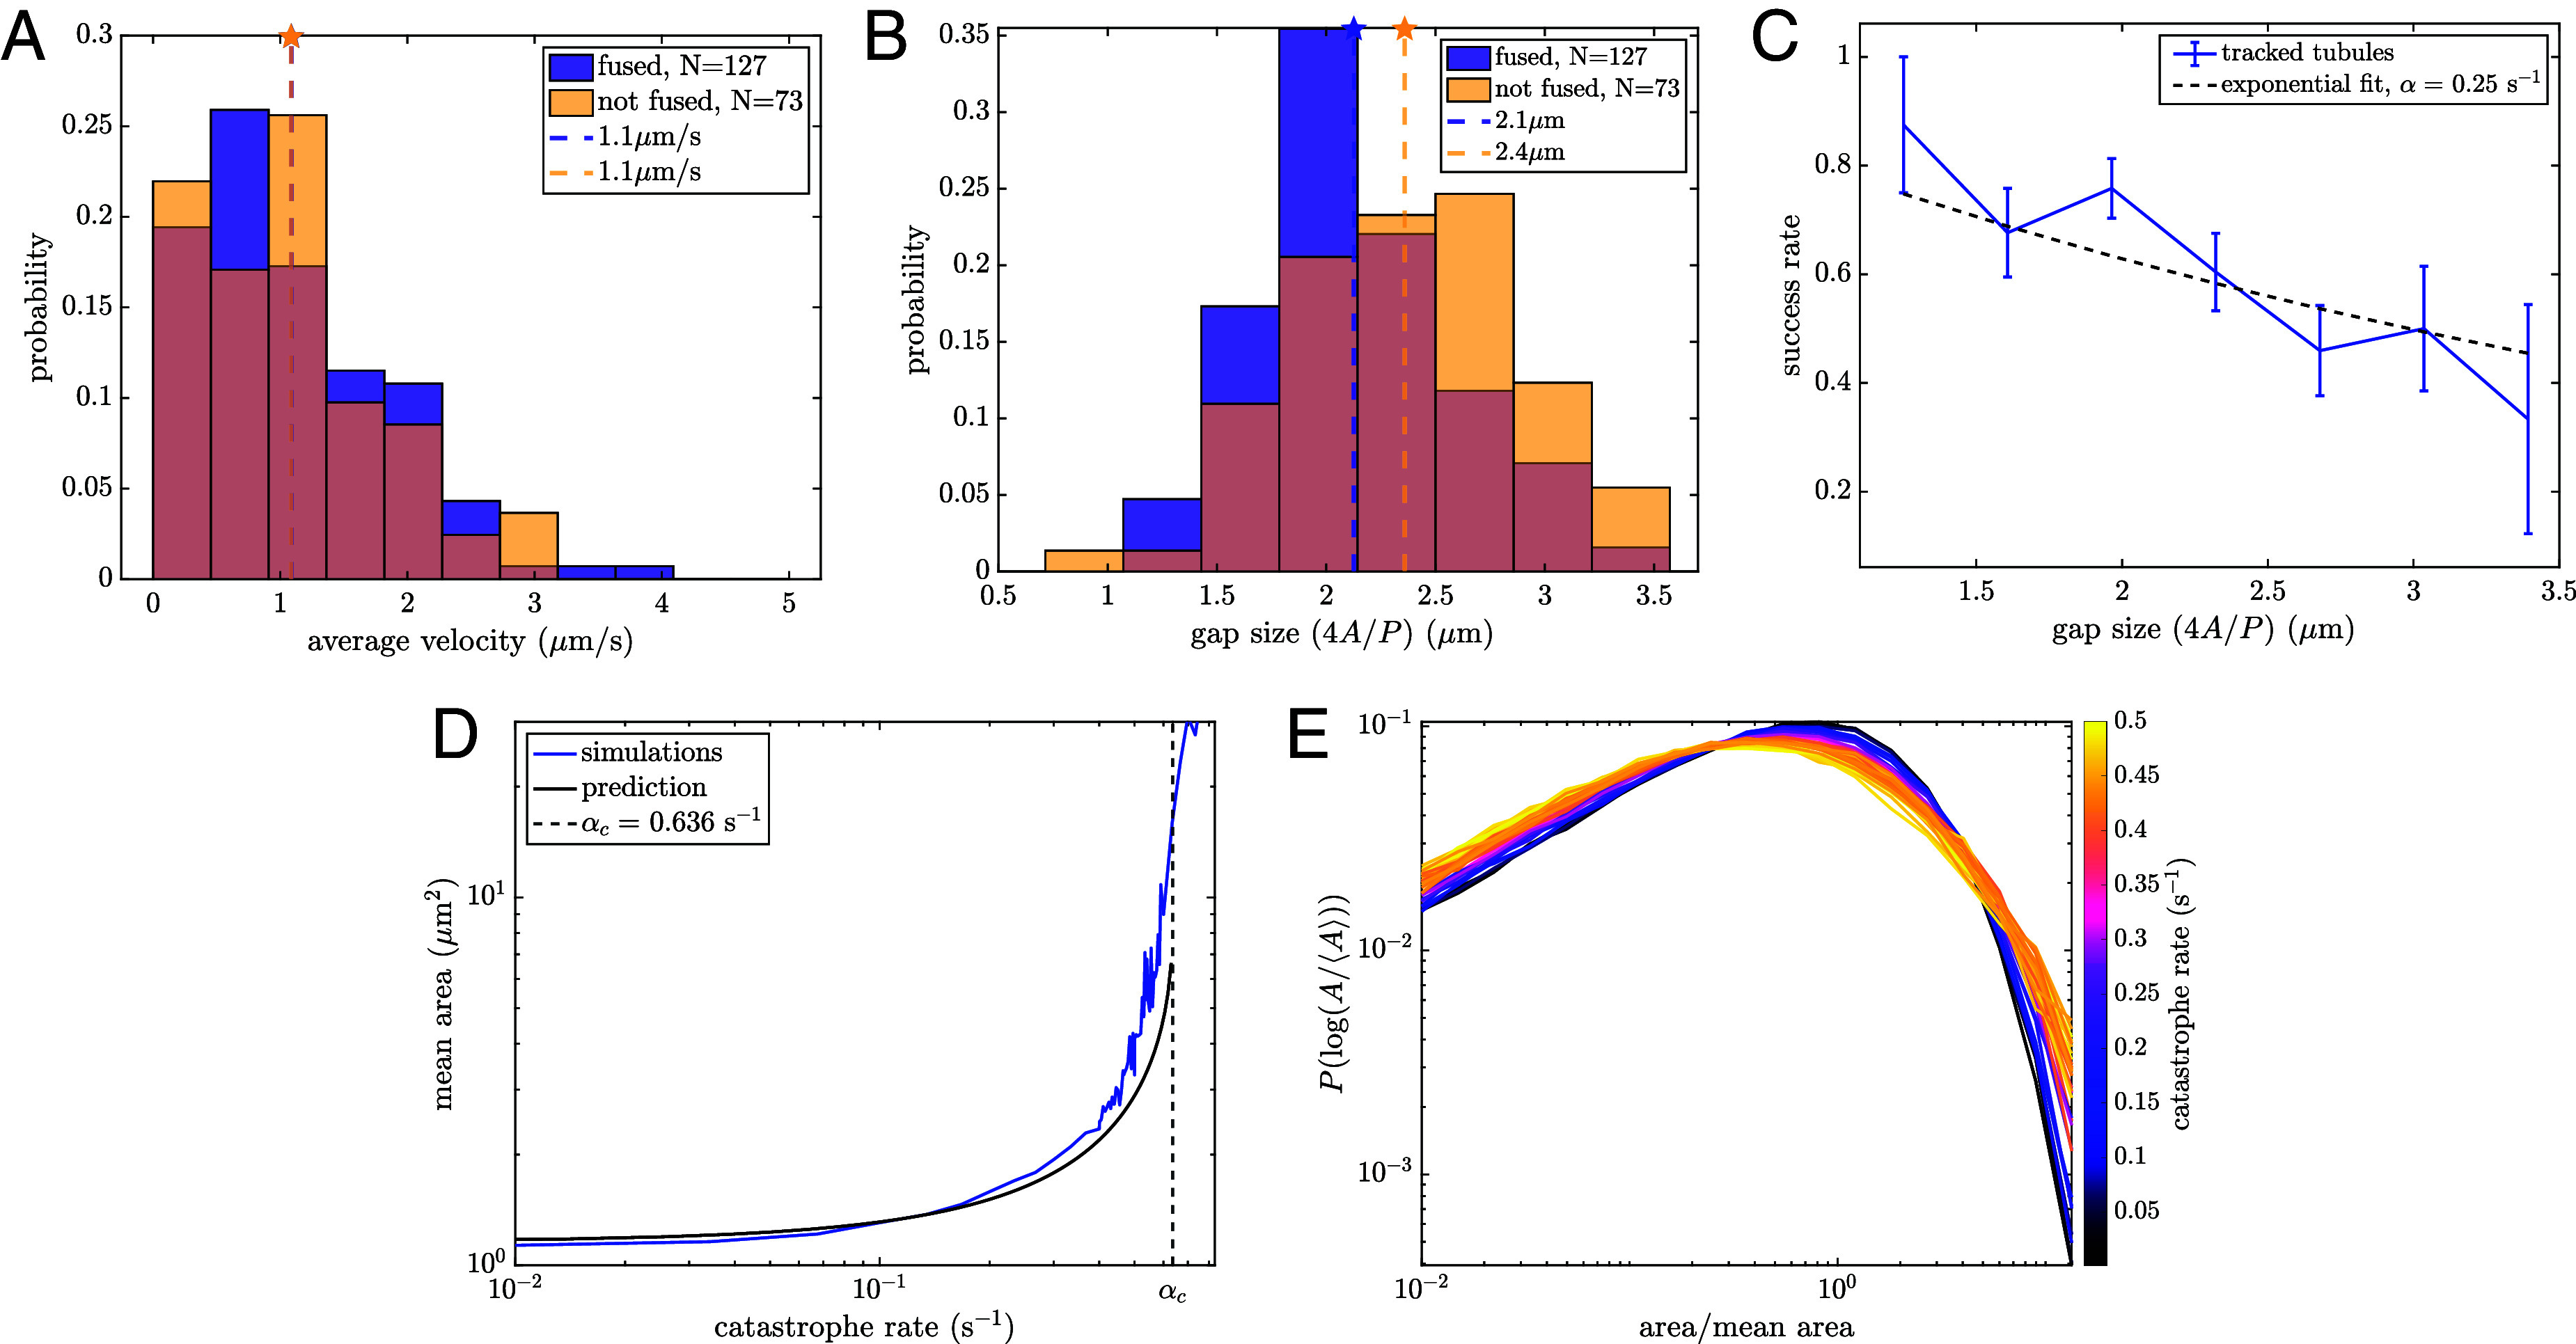
Fig. 6.

Growing tubules undergo catastrophe events that alter polygon size distributions. (A) Velocity distributions of growing tubules that lead to both successful and unsuccessful fusion. Mean of each distribution indicated by a dashed line. (B) Distribution of gap sizes across which tubules are growing for both successful and unsuccessful fusion events. Mean of each distribution indicated by a dashed line. for a one-sided Student’s t test. (C) Success rate as a function of gap size , with fit to indicated by a dashed line. (D) Mean area grows as a function of catastrophe rate. The black line marks analytic prediction. The dashed vertical line shows predicted critical rate beyond which mean areas diverge. (E) Normalized area distributions for liquid networks with increasing catastrophe rates. High catastrophe rate leads to an enrichment of both small and large areas.
