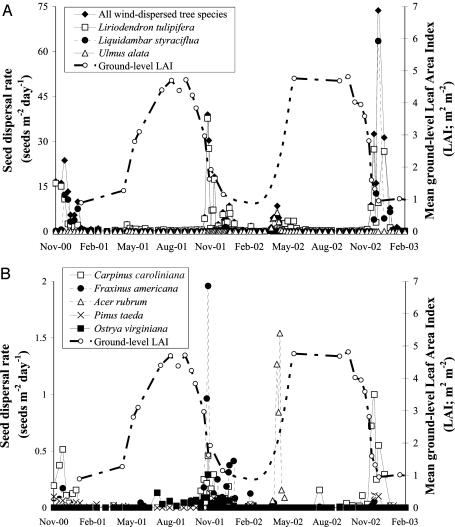
Fig. 1.
Seasonal dynamics of seed dispersal and LAI observed near the meteorological tower at Duke Forest over 27 successive months. Note the difference in dispersal rates between species that were common (A) and rare (B) in the seed traps. The seasonal variation in LAI is shown in both panels for reference. LAI measurements were missing for the period between 2 December 2001 and 18 May 2002; the line drawn between these two points follows a second-order polynomial fitted for LAI data collected during the corresponding period in the previous and the subsequent (not shown) years.

