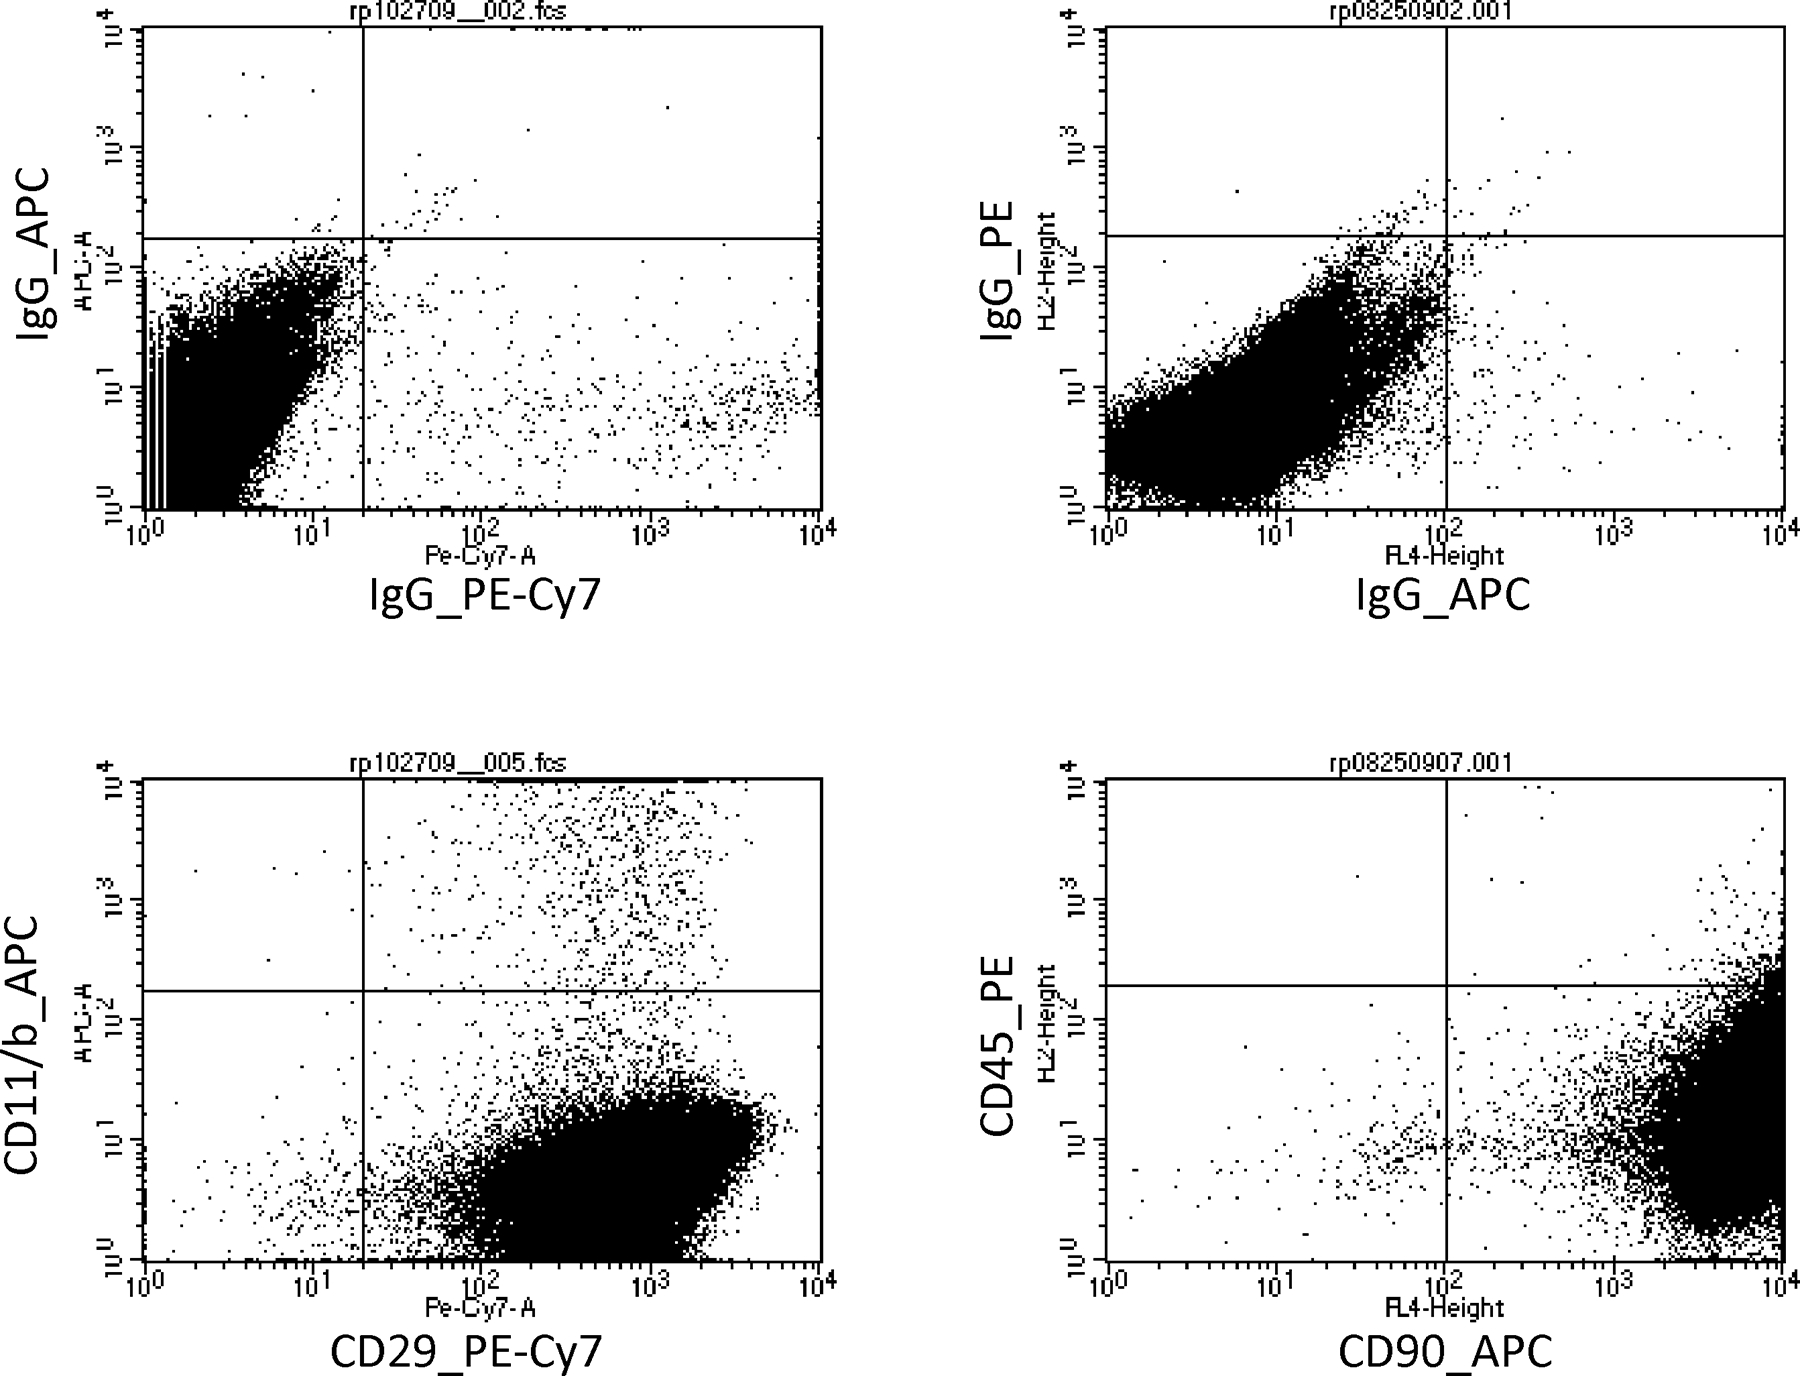
Figure 2.

Characterization of isolated MSCs. Top panels, show the negative controls (IgG) of the CD29, CD45, CD11b/c and CD90. Bottom panels show that isolated MSCs were positive for CD29 (99.4%) and CD90 (99.98%) and negative for CD45 (0.32%) and CD11b/c (0.93%).
