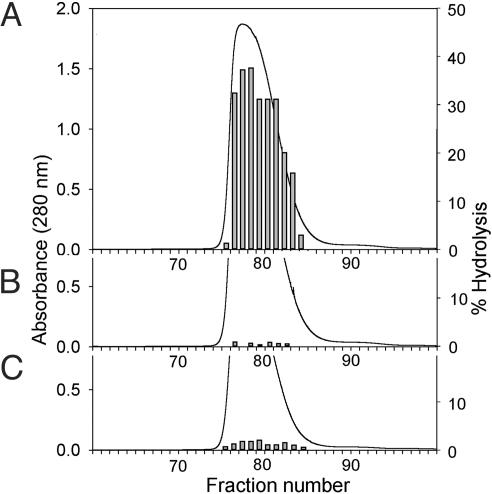
Fig. 1.
Correlation of ATPase activity and protein elution profiles in gelfiltration chromatography. For each of the three proteins, the image represents the elution profile obtained in the last purification step (gel-filtration chromatography through a Hi-Load Superdex-200 column). ATP hydrolysis was quantified by radiometric analysis of 1.0 μl of protein samples after a 5-min reaction in the presence of 10 nM M13 ssDNA. Amount of protein loaded was 35.5 mg of WT TrwBΔN70 (A), 38.7 mg of TrwBΔN70(W216A) (B), and 28.2 mg of TrwBΔN70(K136T) (C).

