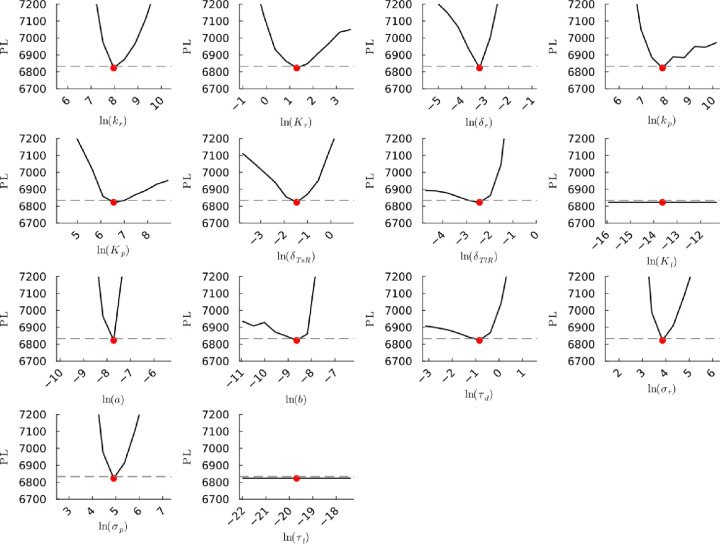
Figure S26b.
(Corrected) Profile likelihoods of parameters from model 2. Each plot corresponds to a parameter in the model and additional fitting parameters (σr, σp, τd). The y-axis of each plot shows the minimized negative log-likelihood of the model with respect to all parameters except for the parameter given its value in the x-axis. The red dot shows the optimized parameter set with the negative MLE. The dashed gray line is the 95% significance threshold line. All logarithms are in natural log.

