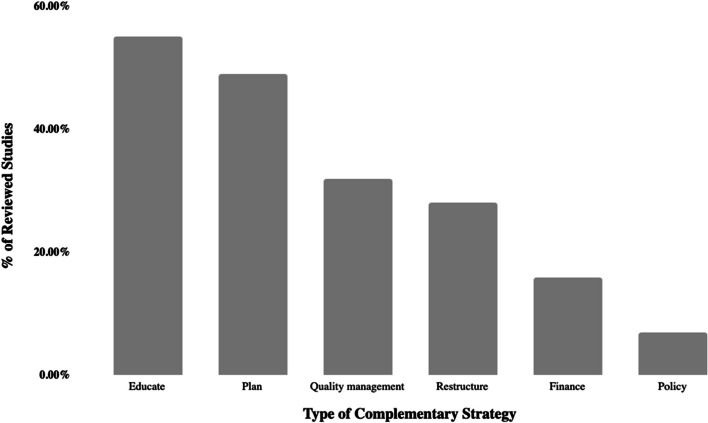
Fig. 4.
Complementary strategies. This bar chart, created in Microsoft Excel, shows the six deductive categories describing complementary strategies carried out alongside champion activation. Each of the articles within the scoping review was labeled with as many of these categories as identified. Percentages were calculated by dividing the total for each category by the total number of articles (74), and categories are shown from highest to lowest percentage

