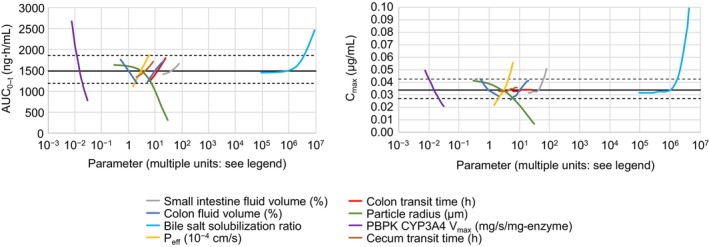
FIGURE 2.

PSA results showing the main parameters that affect AUC0‐t (left panel) and C max (right panel). In each panel, the first eight most influential parameters are displayed for clarity. AUC0‐t, area under the curve from time 0 to the last quantifiable plasma concentration; C max, maximum plasma concentration; CYP3A4, cytochrome P450 3A4; PBPK, physiologically based pharmacokinetic; P eff, effective permeability; PSA, parameter sensitivity analysis; V max, maximum rate of reaction.
