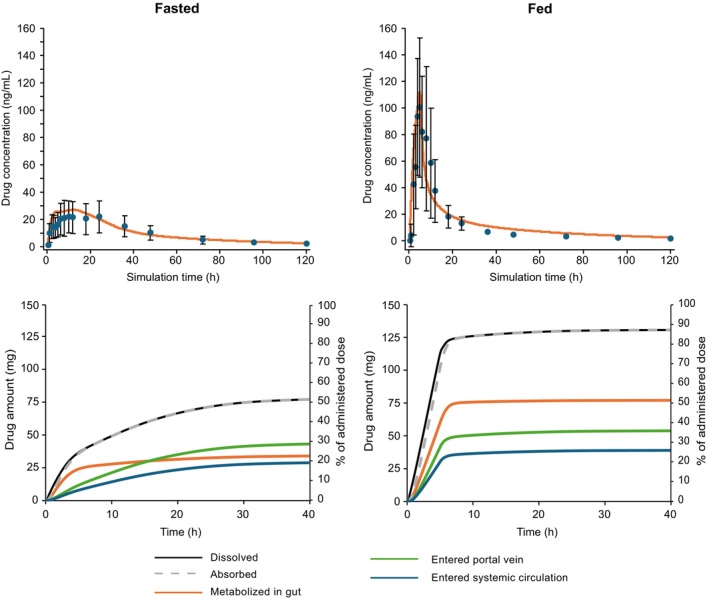
FIGURE 3.

PBBM prediction of omaveloxolone PK profiles (upper panels) and the amount and percentage of drug dissolved, absorbed, metabolized, and entered into the portal vein or the systemic circulation (lower panels) following a single dose of omaveloxolone 150 mg in the fasted (left panels) and fed (right panels) states. In the top panel, the symbols represent the (arithmetic) mean of measured omaveloxolone concentrations and the error bars represent ± standard deviation. PBBM, physiologically based biopharmaceutics modeling; PK, pharmacokinetic.
