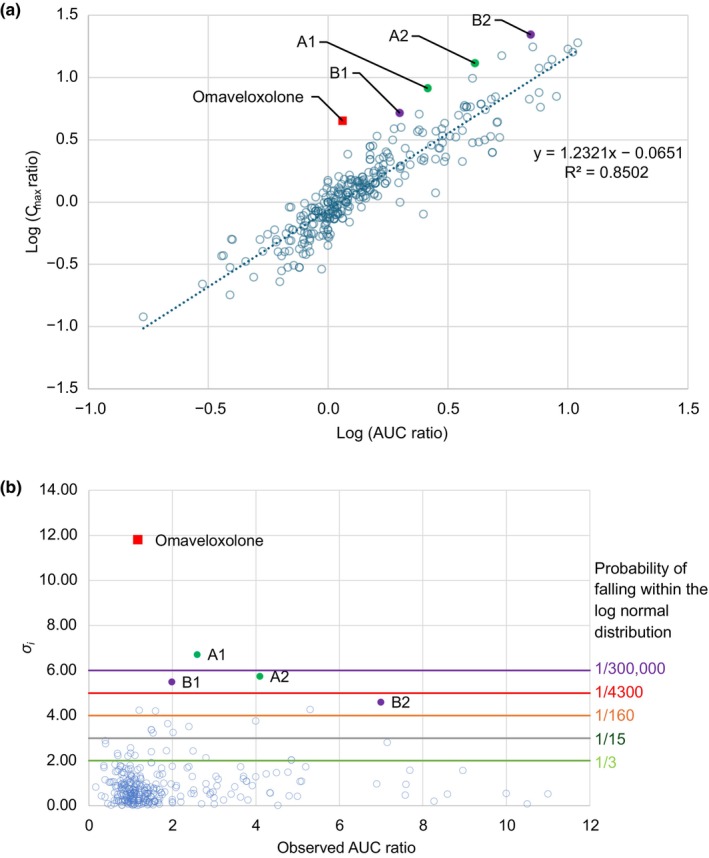
FIGURE 5.

(a) Correlation between fed/fasted C max ratio versus AUC ratio. (b) σ i values for each observed C max ratio versus AUC ratio for omaveloxolone and 323 food effect studies. The solid square symbol shows omaveloxolone. A1: CPD3 100 mg administered with a high‐fat meal 38 ; A2: CPD3 50 mg administered with a high‐fat meal 38 ; B1: progesterone—Utrogestran 200 mg administered with a 688‐calorie meal containing 34% fat content 39 ; B2: progesterone—Utrogestran 100 mg administered with an 890‐calorie meal containing 55% fat content. 27 σ i , mean of sigma; AUC, area under the curve; C max, maximum plasma concentration; CPD3, adenosine monophosphate deaminase inhibitor.
