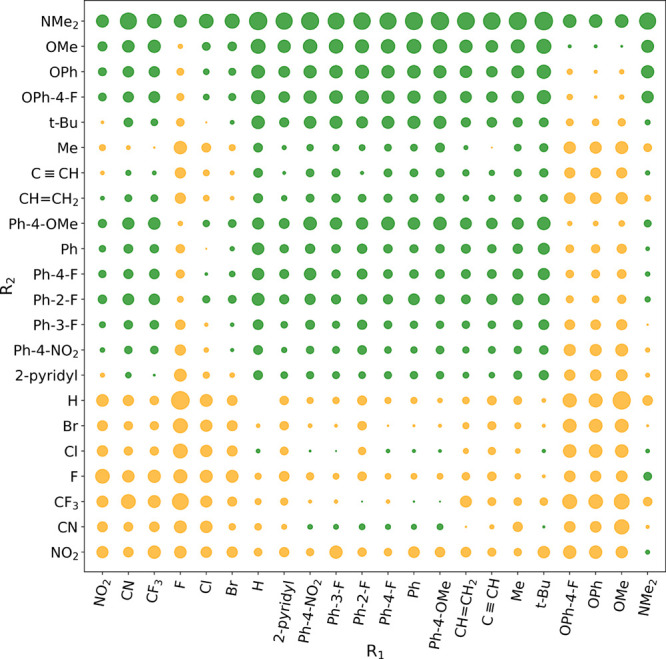
Figure 4.

Effect of the R1 and R2 substituents on ΔΔG (ΔG‡C – ΔG‡O). Positive ΔΔG values indicate the superiority of path O (represented by green circles), while negative ΔΔG values suggest greater favorability for path C (represented by orange circles). The diameter of each circle is proportional to the magnitude of ΔΔG. Small circles denote a minor energy difference in the activation barrier values between the two pathways.
