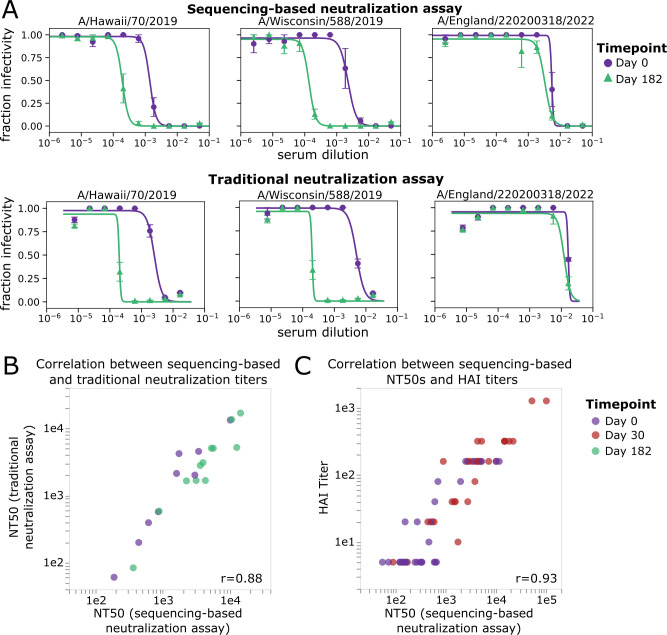
Fig 4.
NT50s measured with the sequencing-based neutralization assay are highly correlated with those measured using a traditional neutralization assay. (A) Example neutralization curves against sera collected from study participant D10378 collected on day 0 or day 182 post-vaccination, measured using the sequencing-based neutralization assay (top) or a traditional one-virus versus one-serum fluorescence-based neutralization assay (bottom) (24, 25). For the sequencing-based assay, the error bars represent the standard error of curves for replicate barcodes corresponding to the same strain from the same well; for the traditional neutralization assay, the error bars represent the standard error of two replicate measurements calculated from separate wells. (B) Correlation between NT50s for eight serum samples against three virus strains measured using the sequencing-based neutralization assay or a traditional fluorescence-based neutralization assay. Each point represents a different serum-virus pair (the virus strains shown are A/Hawaii/70/2019, A/Wisconsin/588/2019, and A/England/220200318/2022), and points are colored by the day post-vaccination the sample was collected. The Pearson correlation (r) is indicated on the plot. (C) Correlation between NT50s measured with sequencing-based neutralization assay versus HAI titers against the A/Hawaii/70/2019 virus strain for 30 serum samples collected on day 0 or day 30 post-vaccination. The dynamic range for the HAI titers was smaller than that used for neutralization assays (5–1,280 vs. 20–393,660).

