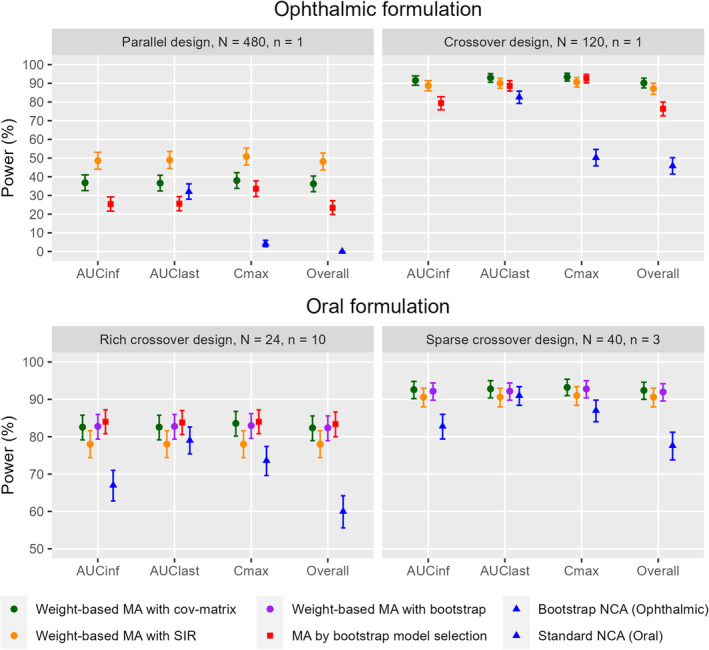
FIGURE 4.

Method comparison of power for bioequivalence tests of AUC∞, AUClast, C max, and all metrics combined (overall) in the ophthalmic product scenarios (top) and oral product scenarios (bottom). Error bars represent the 95% binomial proportion confidence interval of the power. Please note that not every method was examined in every scenario. The bootstrapped NCA method does not produce AUCinf. N represents the number of subjects and n represents the number of samples per subject and period in each scenario.
