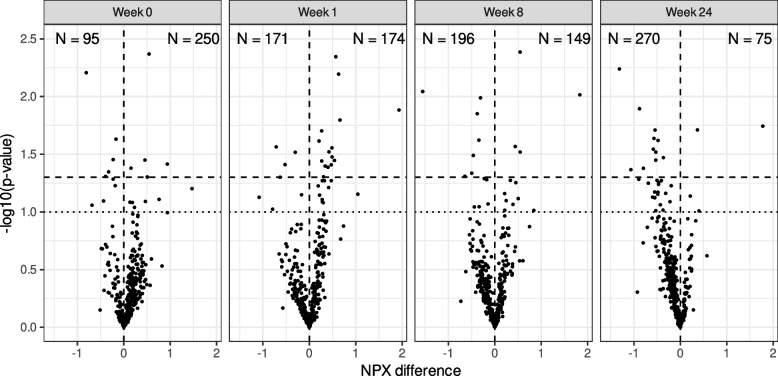
Fig. 2.
Differential protein expression between the FMT and placebo groups over time. The figure shows the number of proteins overexpressed (positive values) or underexpressed (negative values) in the FMT group compared to the placebo group at different time points (weeks 0, 1, 8, and 24). The text at the top of each graph indicates the number (N) of proteins overexpressed (right) or underexpressed (left). The upper quadrants represent DEIPs with a p value < 0.05 (dashed line) or < 0.1 (dotted line), not adjusted by FDR. n = 29 biologically independent samples from 14 individuals in the FMT group and 15 in the placebo group were measured at four time points

