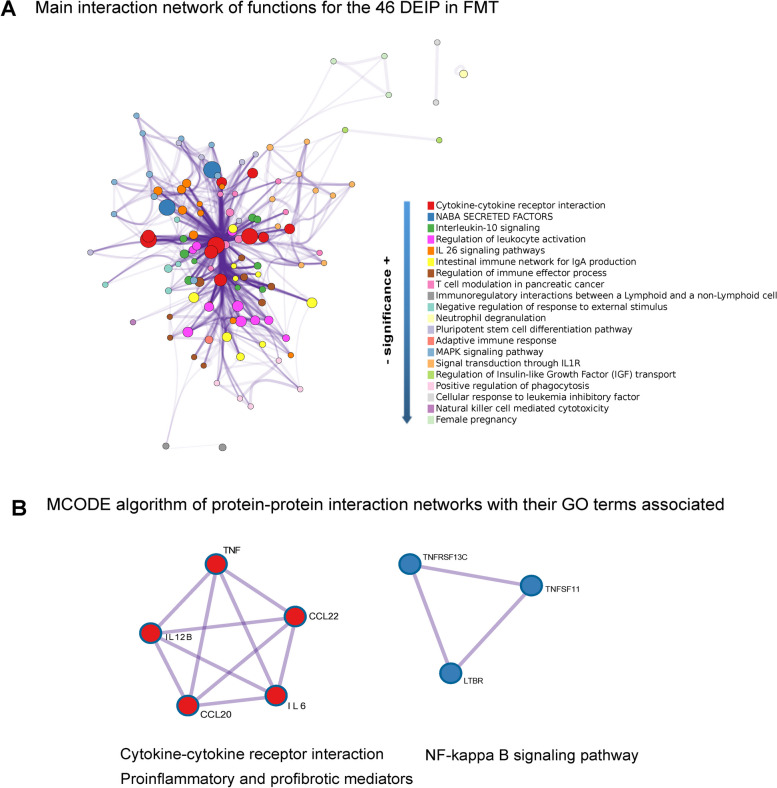
Fig. 4.
Network analysis of differentially expressed inflammatory proteins in PWH receiving repeated FMT vs. placebo. A This Cytoscape network graph visualizes the biological functions and pathways associated with the 46 DEIPs between PWH who underwent FMT and those who received a placebo. The nodes represent the number of proteins involved in the indicated process and their color functional clusters. The size of the nodes represents the number of proteins associated with that function (the larger the node is, the greater the number of selected proteins involved in that function). The color represents its cluster identity (i.e., nodes of the same color belong to the same cluster). Edges connect the related biological processes, and their width shows the strength of the connection between the proteins and the Gene Ontology (GO) term assigned. Terms with a similarity score > 0.3 are linked by an edge (the thickness of the edge represents the similarity score). The purple intensity denotes the superposition of the edges. B These subnetworks illustrate two distinct molecular complexes identified within the protein-to-protein interaction network of the differentially expressed inflammatory proteins. The tool finds protein‒protein interactions previously demonstrated experimentally. Each node represents a protein, and each edge denotes the physical protein‒protein interaction described between them. The MCODE algorithm groups nodes (elements in the network) together based on the strength and number of interactions they have with each other. Although the MCODE algorithm itself does not directly assign functional meaning to the identified subnetworks, the main functions (GO terms) related to these proteins with a p value < 0.01 are indicated below the subnetworks. Detailed information about the enrichment analysis, statistical values, and specific proteins associated with the functions is provided in Table S4 and its caption

