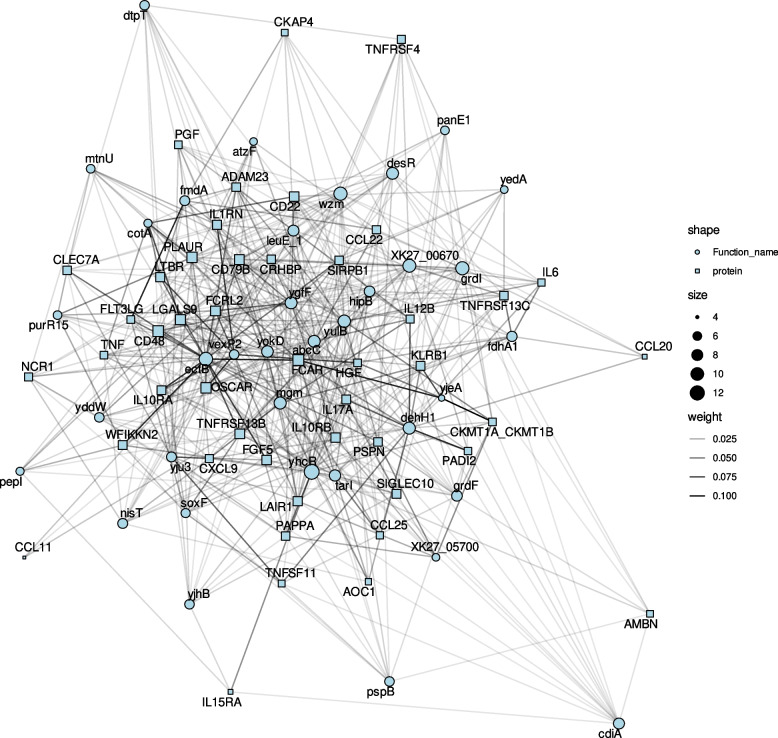
Fig. 7.
Correlation network of bacterial genes correlated with DEIPs. The network illustrates significant correlations between bacterial genes and DEIPs in plasma, focusing on genes significantly associated with at least 5 DEIPs. Circles represent bacterial genes, and squares represent DEIPs. The edge intensity on a grayscale indicates the strength of the correlation, with darker edges denoting stronger associations. The node size reflects the number of significant correlations. Several bacterial genes exhibited multiple significant correlations with DEIPs, highlighting their potential role in modulating inflammation

