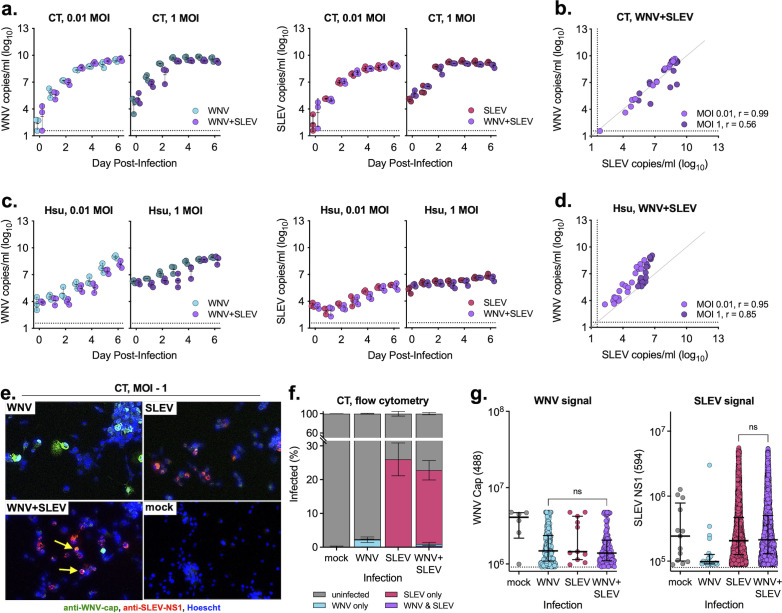
Fig 3.
WNV and SLEV coinfection in mosquito cells. (a and b) CT (Cx. tarsalis) and (c and d) Hsu (Cx. quinquefasciatus) cells were infected at two MOIs individually or coinfected with WNV and SLEV; supernatant was sampled daily and tested for viral RNA as measured by qRT-PCR (performed in biological triplicate, mean ± standard deviation). No comparisons were significant with a two-way ANOVA with Šídák’s multiple comparison test, P > 0.05. Relationship between WNV and SLEV in the coinfected (b) CT and (d) Hsu cells. Spearman r noted in figures. (e and f) Cells were individually infected or coinfected and after 5 days fixed and stained for WNV and SLEV viral protein and (e) imaged for confocal microscopy and (f and g) flow cytometry. (f) Percentages of uninfected, singly infected, and coinfected cells were determined for each infection conditions (performed in biological triplicate, mean ± standard deviation). (g) Fluorescent intensity rates of WNV capsid 488 and SLEV NS1 594-positive populations were compared (median ± interquartile range). Comparisons were not significant with a one-way ANOVA with Tukey’s multiple comparison test. Flow cytometry plots and gating are shown in Fig. S2. Dashed lines represent limits of detection.

