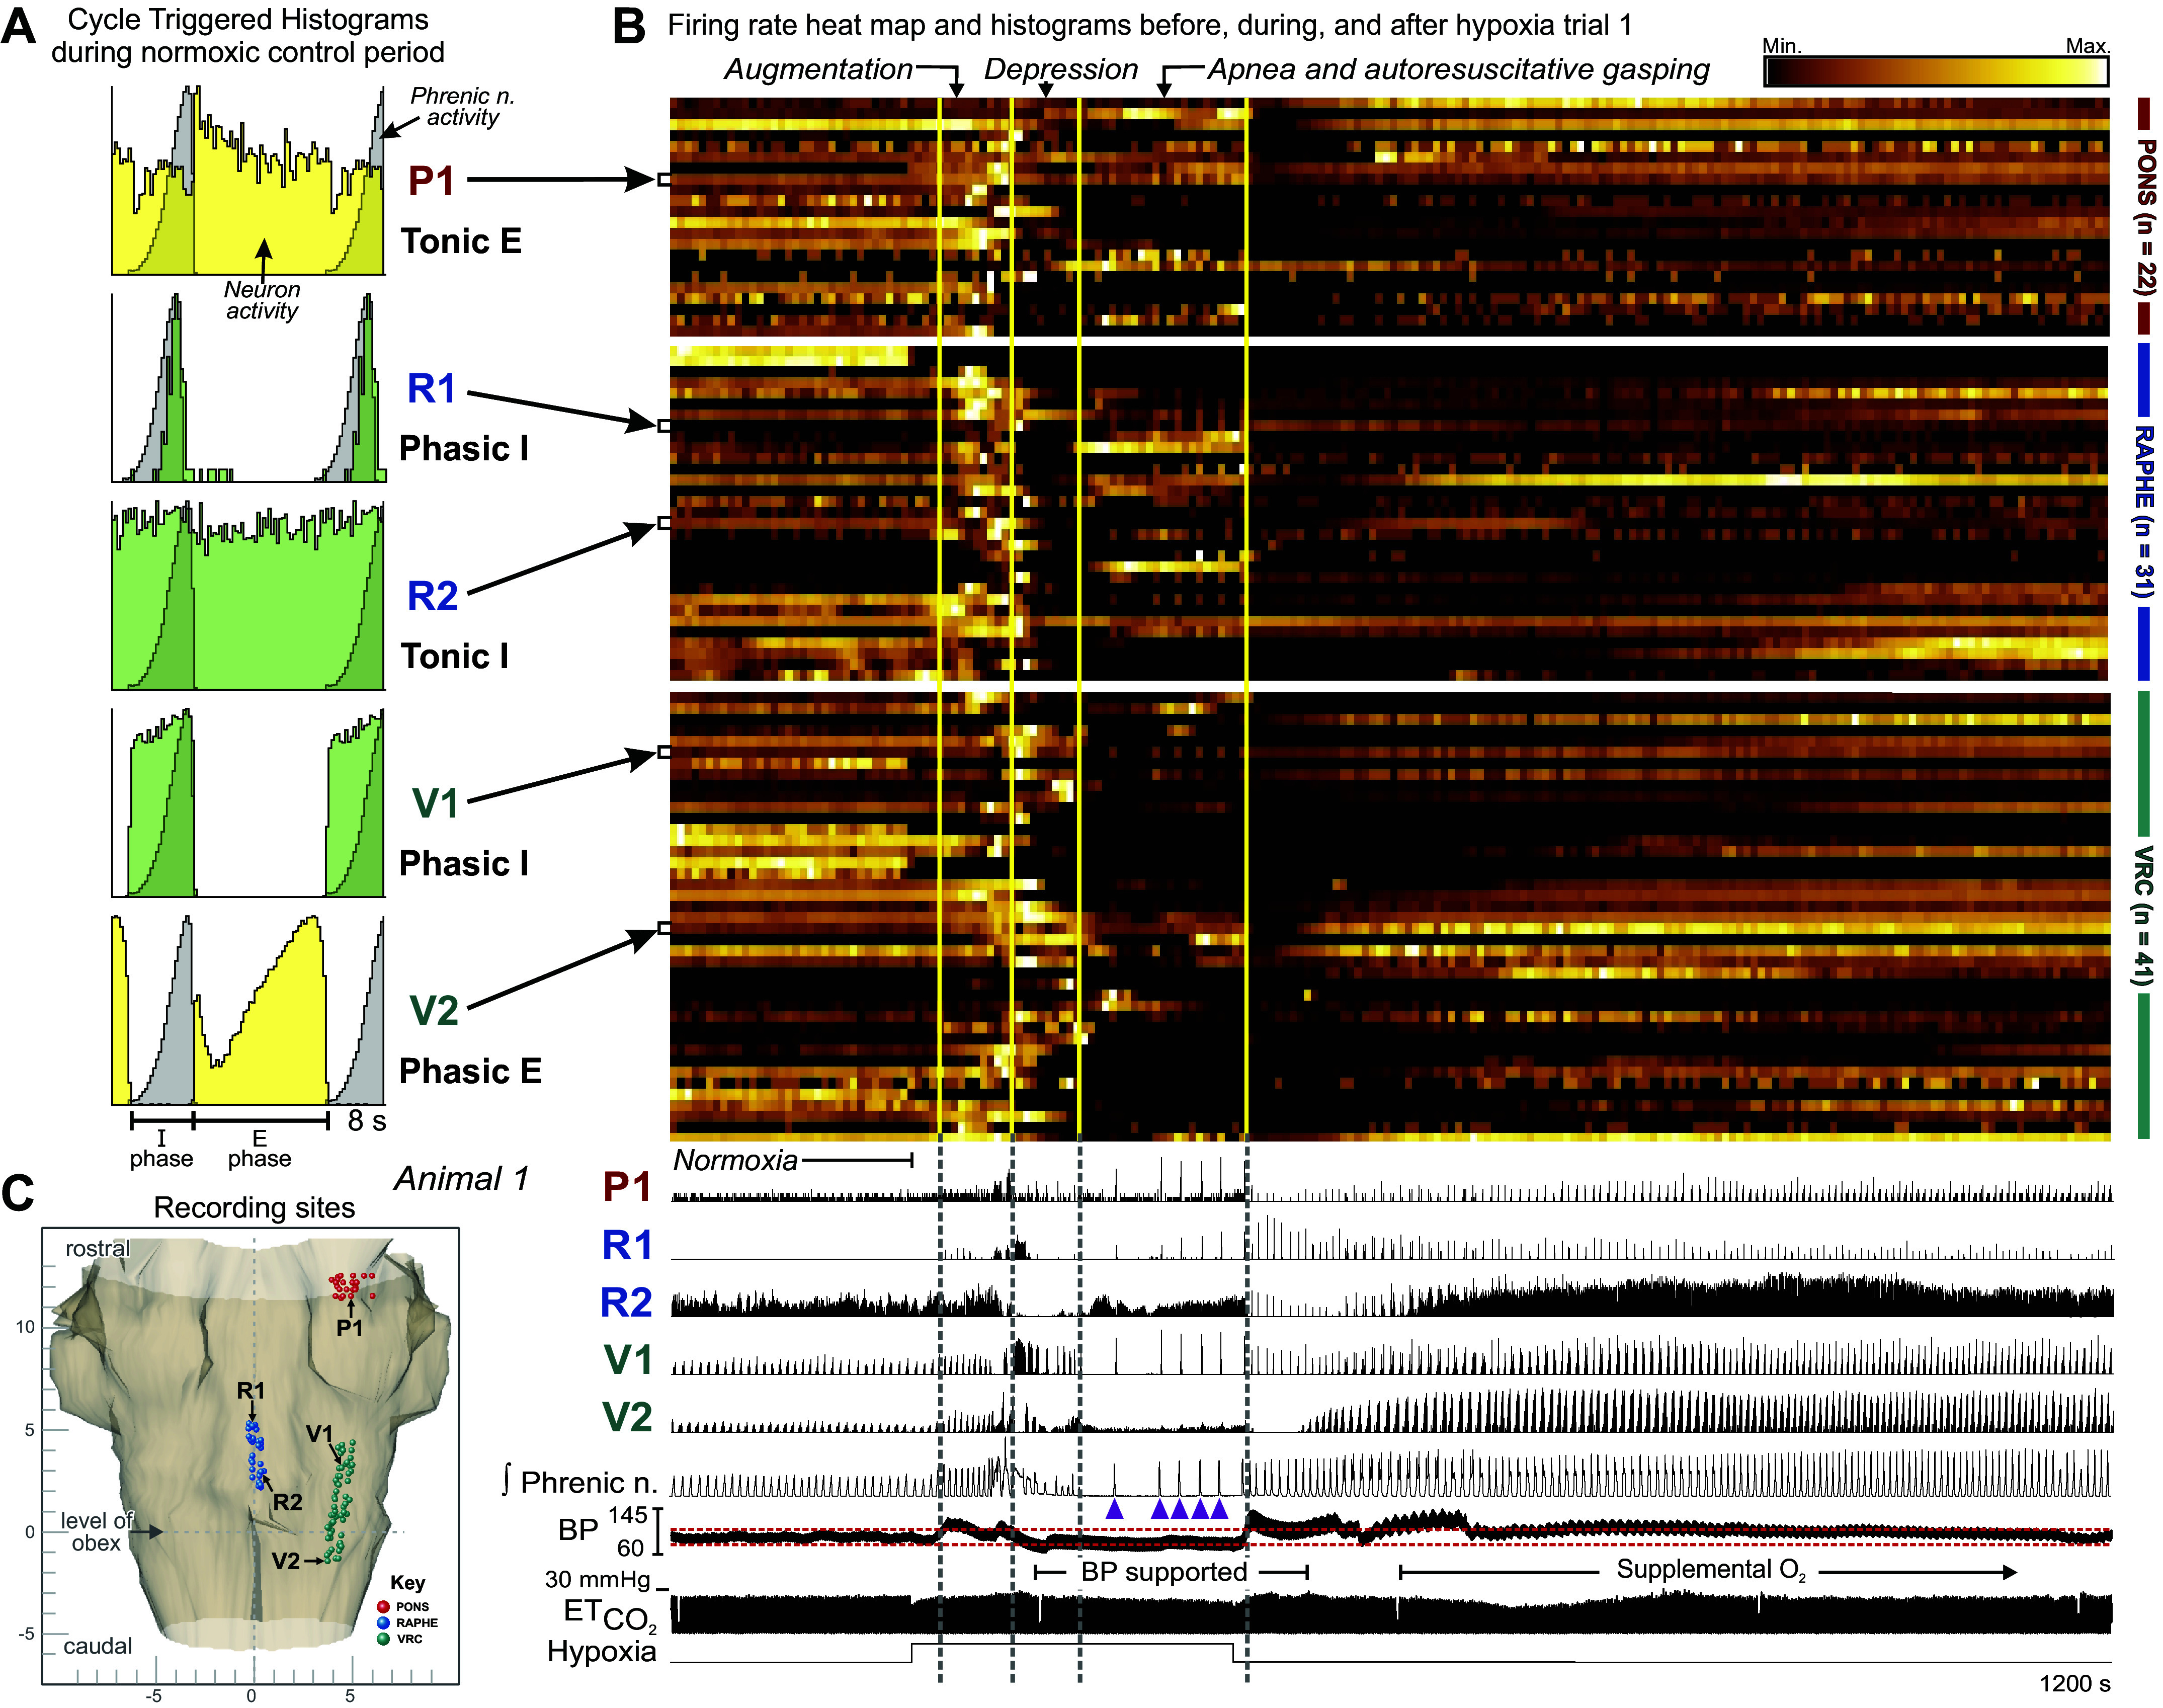
Figure 1.

Neurons change their firing rates and patterns of activity during a hypoxia-evoked sequence of motor patterns produced by ventilation with 5% O2. A: selected phase-normalized respiratory cycle-triggered histograms (CTHs) show the firing patterns of 1 pontine cell (P1), 2 ventral respiratory column (VRC) neurons (V1, V2), and 1 midline raphe cell (R2) during the normoxic control period. Cell R1 was not active during control; data for its CTH were collected during and after the hypoxic exposure. Inspiratory (I) and expiratory (E) phase durations are indicated beneath the CTHs. B: firing rate heat map (top, with luminance proportional to respective normalized rates) and firing rate histograms for 94 of 116 neurons recorded in animal 1 during hypoxia trial 1, together with integrated phrenic nerve activity, blood pressure (BP), and end-tidal CO2 () (bottom); hypoxic gas ventilation was applied for 268 s. Gasp bursts are indicated by purple arrowheads. Brain stem regions are indicated on right of the traces. Blood pressure was supported by the inflation of an embolectomy balloon catheter in the descending aorta as marked; red dashed lines in blood pressure trace indicate blood pressure range seen during preceding control interval. Note that 100% O2 was added to the ventilation gas after blood pressure support was withdrawn. These data document a variety of changes in neuronal firing rate and pattern as the drive to breathe is first augmented and then depressed to an apneic state interrupted by a gasping motor pattern; diverse rates occurred during recovery from hypoxia as well. Vertical lines through the heat map and rate histograms separate periods of respiratory augmentation, depression, and apnea and autoresuscitative gasping motor patterns. C: dorsal view of the stereotaxic coordinates of electrode tips (i.e., recording sites) in animal 1 monitored simultaneously in the VRC (green), pons (red), and midline raphe (blue) mapped into the brain stem atlas.
