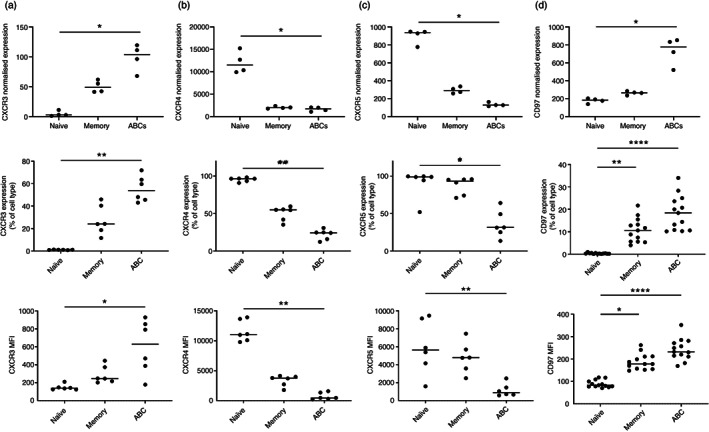
FIGURE 4.

Age‐associated B cells (ABCs) show distinct patterns of chemokine receptor and adhesion molecule expression. The first‐row graphs show housekeeping gene‐normalized gene expression of the validated markers in early rheumatoid arthritis (eRA) patients (n = 4). For the validation, whole blood from eRA patients (n = 6) was stained with an antibody panel for flow cytometry analysis. The percentage of positive cells for each marker in the B‐cell subsets (gated as outlined in Figure S1a) is shown in the second row of panels and the median fluorescence intensity (MFI) in the third row. The horizontal line represents the median value. Statistical significance was assessed using the Friedman test with Dunn's multiple comparisons of each subset against the others; *p < 0.05; **p < 0.01; ****p < 0.0001. CXCR3 (a), CXCR4 (b), CXCR5 (c) and CD97 (d)
