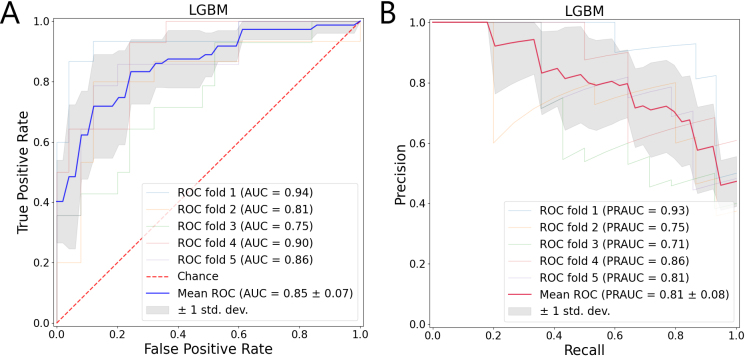
Figure 3.
The training performance of the five cytokine features derived LGBM modelling based on Training1 of division 1. (A). The mean AUC curve is shown in blue. The light gray shade shows the standard deviation stemming from the five-fold-cross validation results. (B). The PRAUC mean is shown in red. The light gray shade shows the standard deviation stemming from the five-fold-cross validation results. AUC: Area Under the Curve, PRAUC: Precision Recall Area Under the Curve.

