Figure.
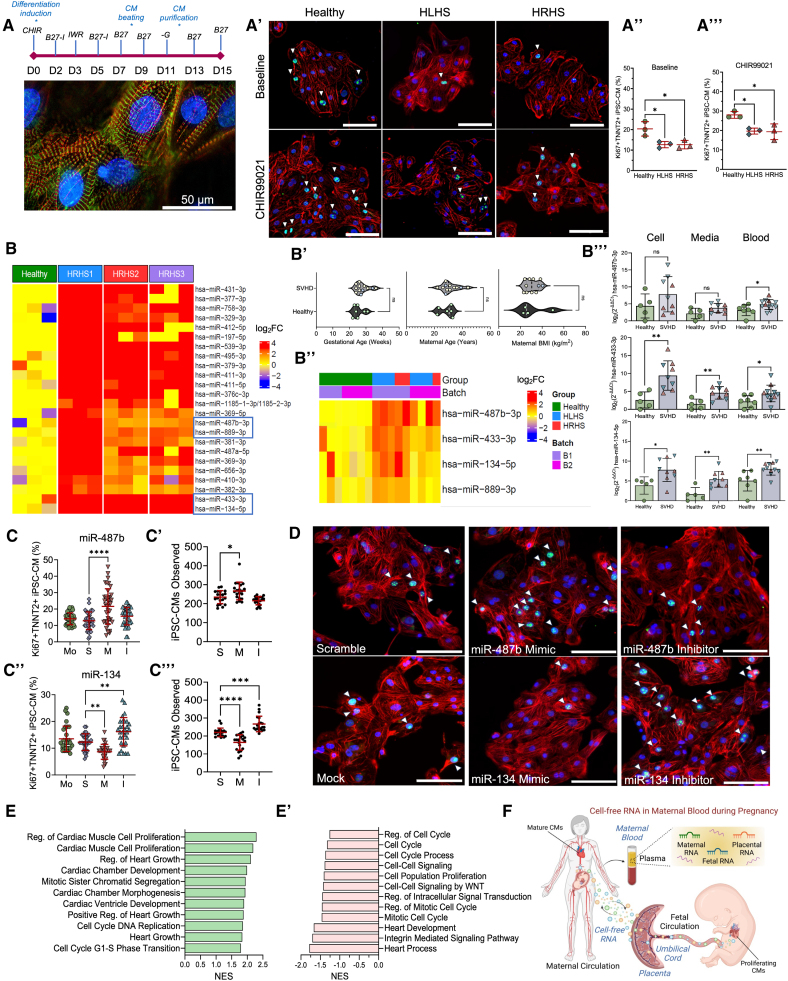
Enriched cell-free RNA from single ventricle heart defect (SVHD) pregnancies dysregulates human cardiomyocyte (CM) proliferation. A, A cardiac differentiation protocol and immunofluorescence image of induced pluripotent stem cell–derived CMs (iPSC-CMs) with expression of α-actinin (green) and cardiac TNNT2 (cardiac troponin T) (red). A′, Cell proliferative ability of SVHD and healthy D15 iPSC-CMs is evaluated at baseline or with CHIR99021. Ki67 (green), TNNT2 (red), and nuclei (blue). A″ and A‴, Quantitative analysis of Ki67+TNNT2+ iPSC-CMs from healthy (n=3), HLHS (hypoplastic left heart syndrome) (n=3), and HRHS (hypoplastic right heart syndrome) (n=3) subjects at baseline and with CHIR99021. One-way ANOVA with Tukey post hoc comparison test. B, Heatmap of differentially expressed miRNA (DEmiRNA) in culture media of HRHS and healthy iPSC-CMs (Padj≤0.05; fold change [FC]≥2). B′, Demographics of maternal blood donors. Healthy (green), HLHS (yellow), and HRHS (blue). B″, Heatmap clustering shows candidate miRNAs elevated in SVHD pregnancies. B‴, quantitative PCR (qPCR) confirmation of upregulated miRNA candidates in maternal blood, iPSC-CM culture media, and intracellular compartments. Green circles (healthy), pink triangles (HRHS), and inverted blue triangles (HLHS). Student t test. C through C‴, Quantitative analysis of Ki67+TNNT2+ proliferating cardiomyocytes and cell population after perturbation with mock (Mo), scramble (S), miRNA mimic (M), and inhibitor (I) for hsa-miR-487b-3p (C and C′) and hsa-miR-134-5p (C″ and C‴). One-way ANOVA with Dunnett post hoc correction. Data are shown as mean±SD. D, Representative immunofluorescence images of miRNA perturbations in cardiomyocytes from a healthy induced pluripotent stem cell line. Ki67 (green), TNNT2 (red), and nuclei (blue). E and E′, Gene set enrichment analysis identifies significant biological processes affected by hsa-miR-487b-3p (E) and hsa-miR-134-5p (E′) mimic vs inhibitor perturbations. F, Schematic overview of maternal biomarker discovery using cell-free RNA during pregnancy. Scale bars: 50 µm (A) and 100 µm (A′ and D). BMI indicates body mass index; NES, normalized enrichment score; and Reg, regulation. *Padj<0.05, **Padj<0.01, ***Padj<0.001, ****Padj<0.0001.

