FIGURE 2.
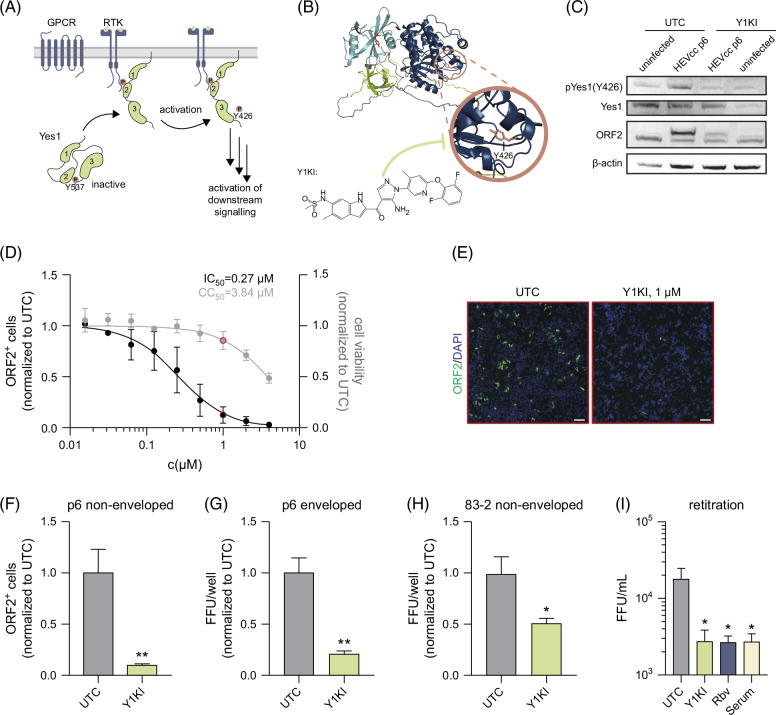
Yes1 activation is a novel HEV-host interaction, and a selective Yes1 kinase inhibitor can effectively reduce HEV infections. (A) Schematic illustration of Yes1’s activation. Yes1 kinase activity is inhibited by phosphorylation at Y537, leaving the protein in a clamped confirmation. Upon activation through GPCRs, RTKs, or Integrins through its SH2 or SH3 domain, Yes1 auto-phosphorylates at Y426 activating its kinase activity. (B) Structure of Yes1 predicted by AlphaFold and illustrated by Pymol. Blue: SH1; turquoise: SH2, green: SH3, red residue: Y537, and pink residue: Y426. Chemical structure of the Yes1 kinase inhibitor (Y1KI, CH6953755). (C) Expression of Yes1 and phosphorylation status at Y426 in HepG2/C3A cell lysates uninfected or infected with HEVcc p6 non-env. Three days p.i. of UTCs or treated with 1 µM Y1KI, respectively. (D, E) HEVcc p6 non-env. infection levels in HepG2/C3A cells under treatment with the indicated concentrations of Y1KI. (D) Quantification of HEV infection levels (black) at 3 days p.i. through CellProfiler analyzing ORF2 protein–positive cells (ORF2+) per image and cell viability (gray) measured using an MTT assay. (E) Representative fluorescence image of UTC or under treatment of 1 µM Y1KI, corresponding to the concentration used in (D) indicated by the red dot. (F–H) Quantification of HEV infection levels of HepG2/C3A cells treated with 1 µM Y1KI infected with HEVcc p6 non-env. (F), HEVcc p6 env. (G), or HEVcc 83-2 non-env. (H). (I) Quantification of intracellular viral titers recovered from lysed HepG2/C3A cells at 3 days p.i. with HEVcc p6 non-env. under treatment of 1 µM Y1KI, 50 µM Rbv, or 1:50 of anti-HEV serum. For all graphs, mean values from 3 independent experiments are depicted. Dose-dependent treatment and 50% inhibitory concentrations (IC50 and CC50) were calculated employing a 4-parameter log-logistic nonlinear regression model (D). To test the significance of mean differences, One-way ANOVA, followed by the Dunnett’s multiple comparison test (I) or Student’s t-test (F–H) were used. p values <0.05 (*), <0.01 (**), <0.001. p values >0.05 were considered to be not significant. Scale bars = 100 µM. Abbreviations: FFU/mL, focus forming units per mL; GPCR, G-protein–coupled receptors; HEVcc, cell culture–derived hepatitis E virus; MTT, 3-(4,5-dimethylthiazol-2-yl)-2,5-diphenyltetrazolium bromide; p.i., post infection; RTK, receptor tyrosine kinases; UTC, untreated control cells.

