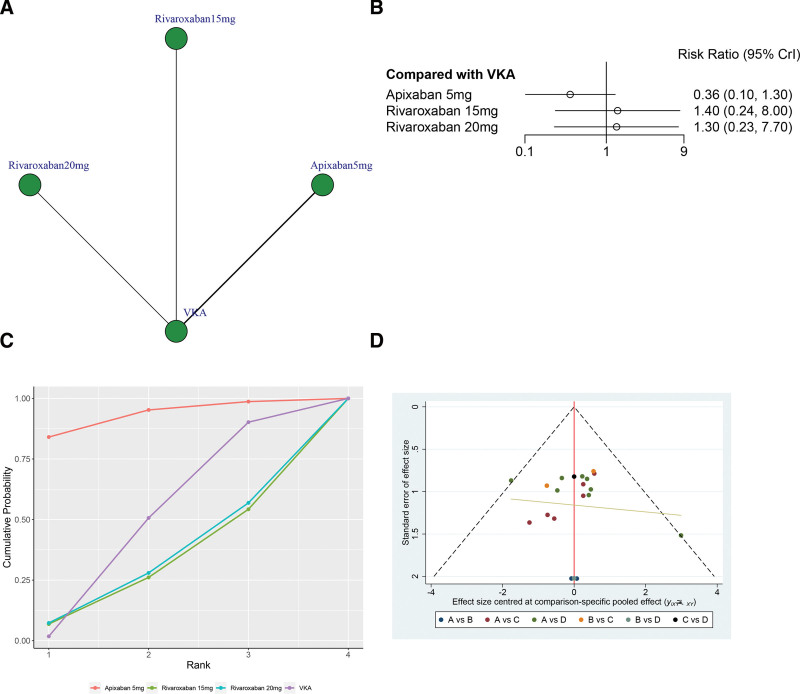
Figure 7.
(A) Network structure diagrams of all bleeding events. (B) Forest plot of the all bleeding events as compared with VKA. (C) Surface under the cumulative ranking curve (SUCRA) probabilities of different treatments for all bleeding events. (D) Funnel plot of the different treatments for all bleeding events.

