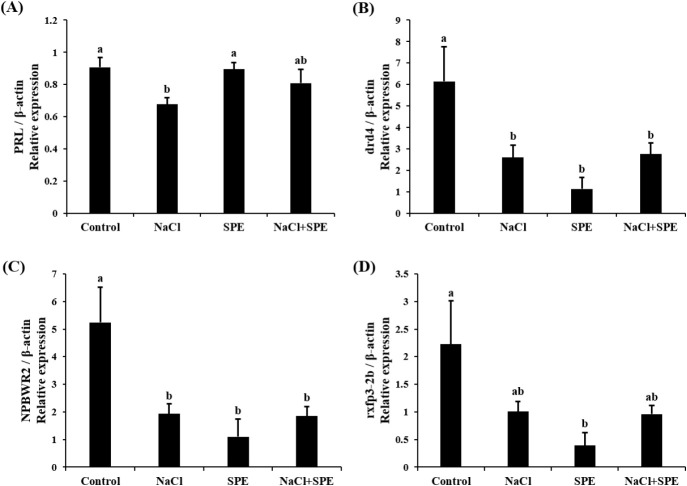
Fig. 5. Expression levels of PRL (A), drd4 (B), NPBWR2 (C) and rxfp3-2b (D) in the pituitary cells from control, NaCl, SPE, and NaCl+SPE groups.
Relative abundance of the mRNA was measured by the comparative threshold cycle method using qRT-PCR and normalized the amount of β-actin mRNA. Results are expressed as means±SEM (n=3–4). Different letters above the bars represent significant differences (p<0.05). SPE, salmon pituitary extract; qRT-PCR, quantitative real-time PCR; PRL, prolactin; drd4, dopamine receptor D4; NPBWR2, neuropeptide B/W receptor 2; rxfp3-2b, relaxin family peptide receptor 3-2b.

