
Extended Data Fig. 7 |. Comparisons between the cryo-EM structure and AlphaFold2 predictions of the yeast TIM23 complex.
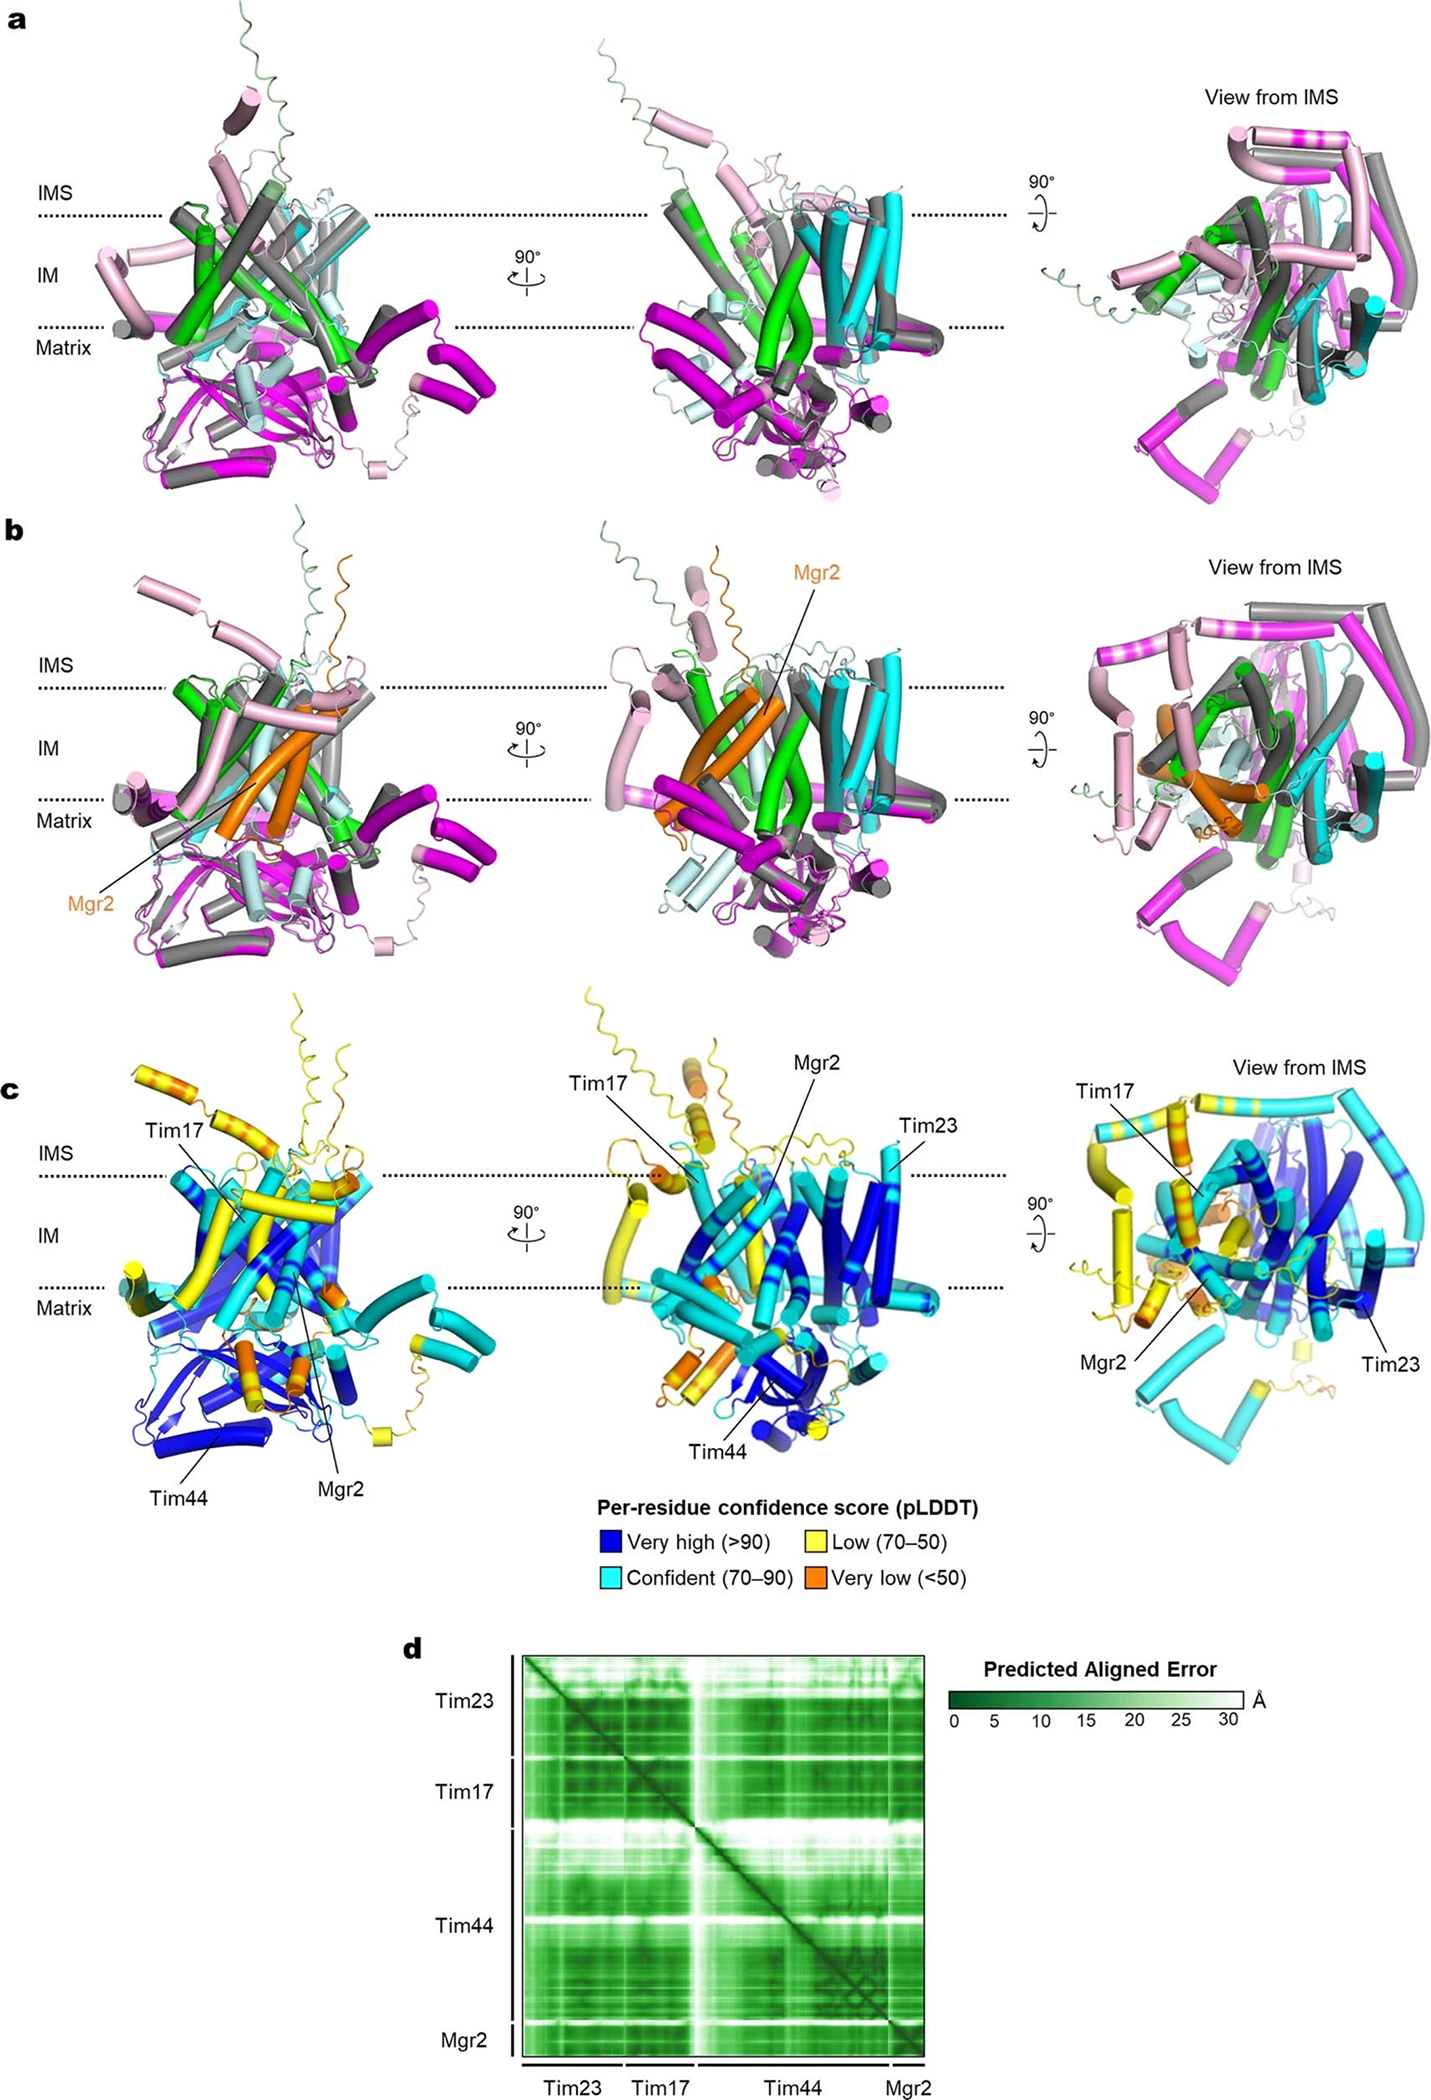
a, Superposition between the cryo-EM structure (gray) and AlphaFold2 model of Tim17–Tim23–Tim44 (in color). For the predicted structure, Tim17, Tim23, and Tim44 are in green, cyan, and magenta, respectively, and low confidence regions (pLDDT<70) are colored in lighter tones. The RMSD is 1.0 Å for 338 Cα atoms out of 480 aligned residues. Predictions were made using AlphaFold2 Multimer version 2.2.0. b, As in a, but the AlphaFold2 model additionally contains Mgr2 (orange). c, As in b, but showing per-residue confidence score of the AlphaFold2-generated Tim17–Mgr2–Tim23–Tim44 model. d, Predicted aligned error (PAE) matrix between all pairs of residues of the Tim17–Mgr2–Tim23–Tim44 AlphaFold2 model.