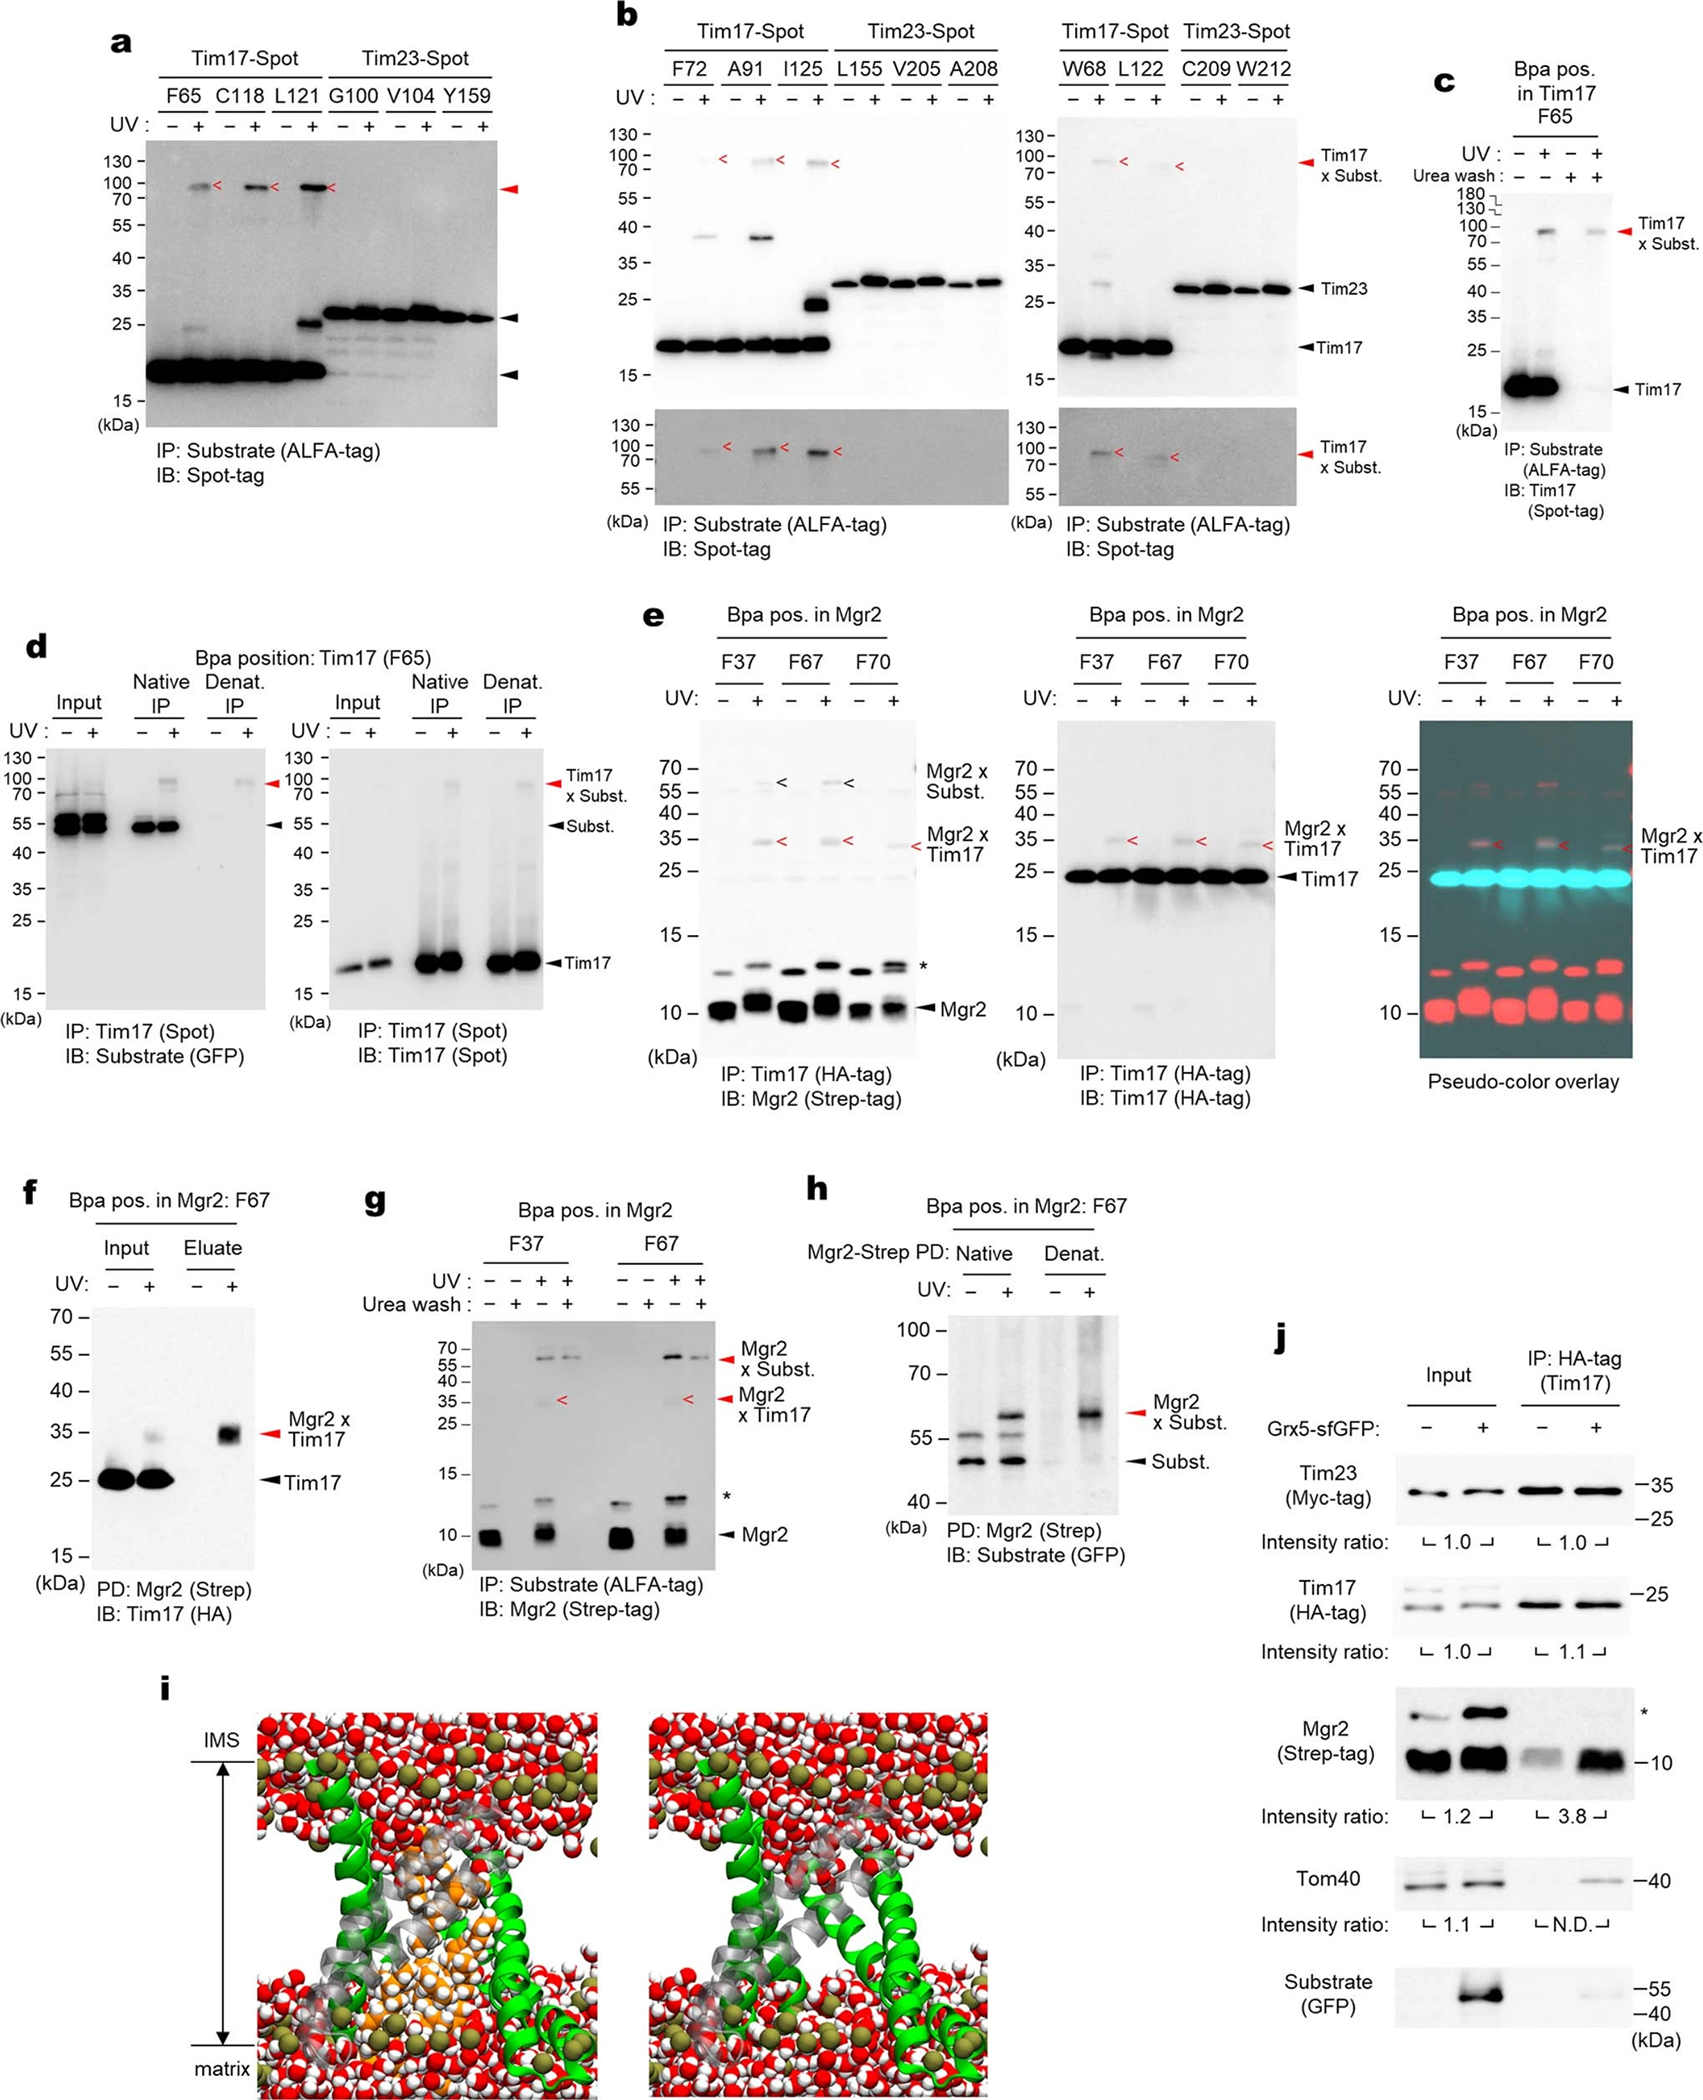
Extended Data Fig. 9 |. Photocrosslinking experiments with Bpa-incorporated Tim17, Tim23, or Mgr2 and characterization of Mgr2 association to translocating Tim17.

a, The blot image of Fig. 3d is adjusted for higher contrast. IP, immunoprecipitation; IB, immunoblotting. b, As in Fig. 3d, but additional positions were tested for Bpa crosslinking. “<” denotes observed crosslinking adducts with the Grx5-S80-sfGFP substrate. c, As in Extended Data Fig. 8f, but verifying the crosslinked band (red arrowheads) between Bpa-incorporated Tim17 and Grx5-S80-sfGFP. d, As in c, but the crosslinked band (red arrowheads) were validated with native and SDS-denaturing IP with Spot-tag nanobody beads. e, Validation for crosslinks between Mgr2 and Tim17. Left, the same image shown in Fig. 3e (IB for Strep-Mgr2); middle, IB for Tim17; right, Overlaid images with pseudo-coloring to show superposition of the crosslinked Mgr2-Tim17 bands between the two blots. f–h, Additional validations for crosslinking between Mgr2 and Tim17 (f) and between Mgr2 and the Grx5-S80-sfGFP substrate (g and h). Panels f and h show results of SDS-denaturing pulldown (PD) with Strep-Tactin resin. Panel g shows a result of ALFA-tag IP in combination with urea wash as in Extended Data Fig. 8f. i, Water does not cross the membrane when lipids are present in the Tim17–Mgr2 cavity (compare with Fig. 3f). MD simulations with lipids initially placed in the Tim17–Mgr2 cavity block water entry. Image taken after 0.8 μs with Tim17 rendered in green ribbons and Mgr2 in semi-transparent gray ribbons, with water (red/white spheres), phosphorous atoms (dark gold spheres), lipid molecules in the Tim17–Mgr2 cavity (orange/white spheres) rendered as van der Waals spheres. The right panel is the same as the left panel but without displaying the lipids. j, Cells induced for Grx5-S80-sfGFP expression and uninduced cells were lysed, and digitonin-solubilized mitochondrial lysates were subjected to HA-tag (Tim17) IP. Eluates were analyzed by immunoblotting. Band intensity ratios between samples with and without Grx5-S80-sfGFP expression were measured by densitometry. N.D., not determined. Data in a–b and j are representative of three independent experiments. Data in c–h are representative of two independent experiments.
