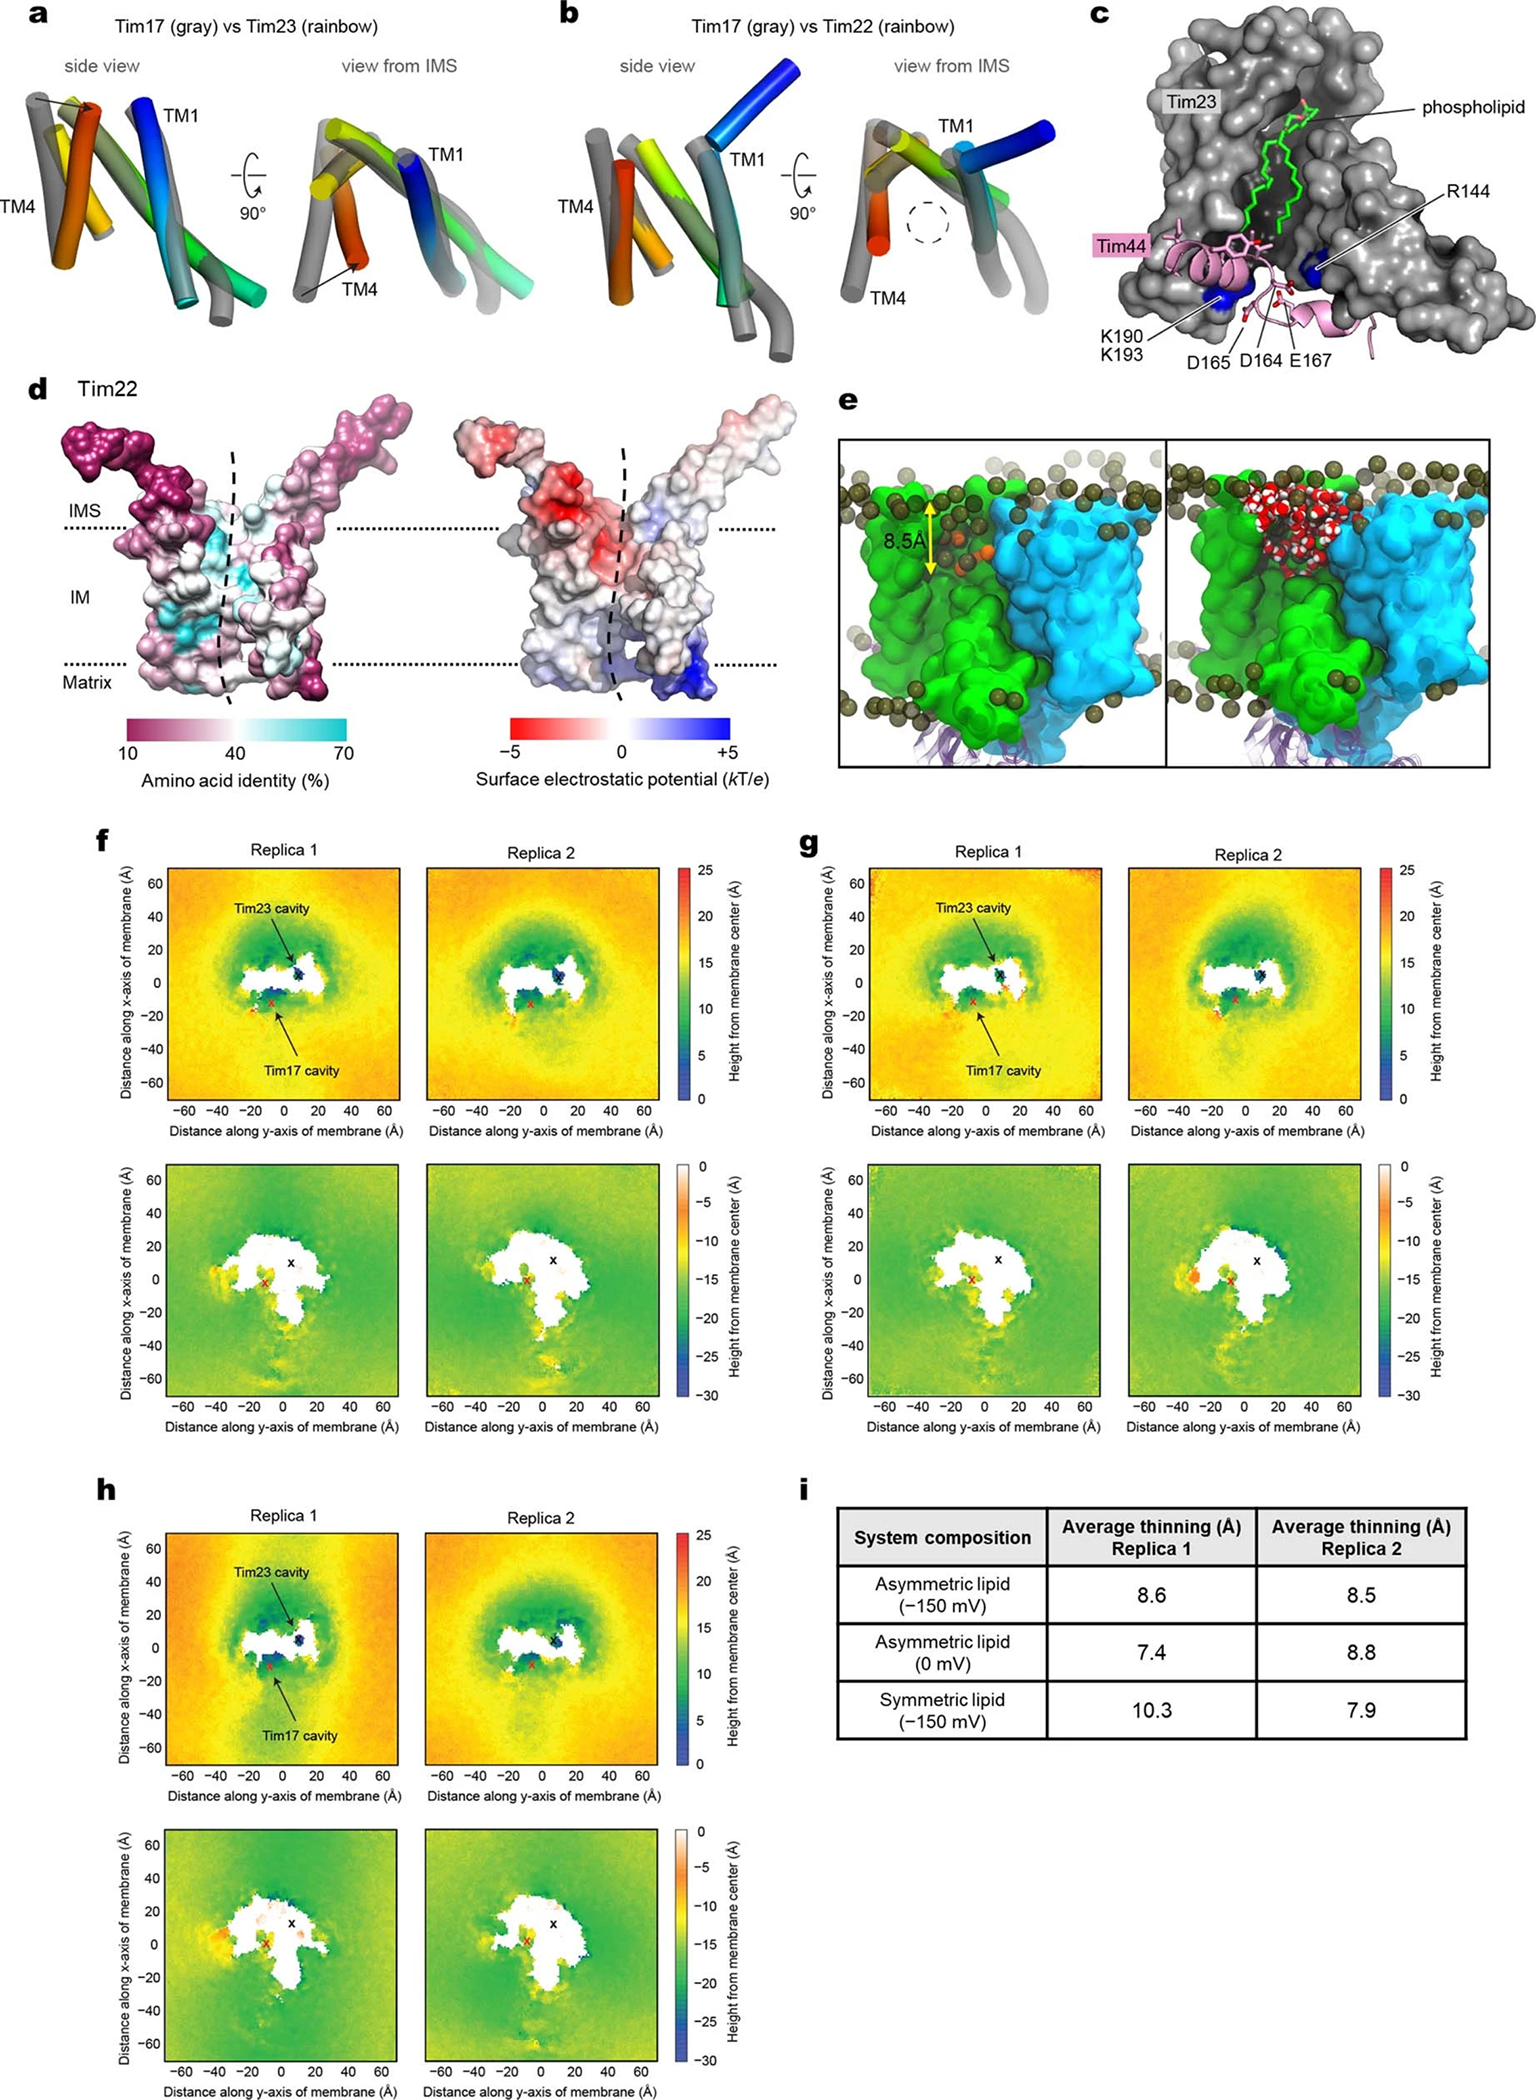
Extended Data Fig. 5 |. Structural comparisons between Tim17, Tim23, and Tim22, and membrane thinning by the cavity of Tim17.

a, Comparison between the transmembrane domains of Tim17 and Tim23. TM1 to TM4 of Tim23 are shown in rainbow color (blue to red). Arrows highlight a difference between the TM4 positions. b, As in a, but comparing between Tim17 and Tim22 (PDB ID: 6LO8). Note that Tim22 has an extra IMS helix to its N-terminus. c, Side view showing the cavity of Tim23 (gray surface). Amino acid residues 153–174 of Tim44 are shown in pink. Note that residues D164, D165, and E167 interact with basic amino acids (R144, K190, and K193; blue) of Tim23. d, As in Fig. 2 a and b, but showing amino acid conservation and surface electrostatics of Tim22 (PDB 6LO8) with a side view into the concave cavity (indicated by a dashed line). e, MD simulated model showing distributions of lipids, ions, and water in the Tim17 cavity. Surfaces are rendered with Tim17 (green) and Tim23 (cyan), while Tim44 is represented with magenta transparent ribbons. Phosphorous atoms of lipids are rendered as dark gold spheres and potassium ions are rendered as orange spheres. In the right panel, extensive hydration (water is rendered in red/white spheres) was observed in the Tim17 cavity. The membrane thinning in the Tim17 cavity is approximately 8.5 Å (also see f–i). f, As in Fig. 2e, but showing two replicas of simulation with an asymmetric lipid composition and a membrane potential of −150 mV. Upper and lower panels show membrane heights from the membrane center toward the IMS and the matrix, respectively. Replica 2 is the result shown in Fig. 2e. g, As in f, but without membrane potential. h, As in f, but with a symmetric membrane composition. i, Summary of membrane thinning, calculated as the averaged difference of the height of the IMS and matrix leaflets in a 10-Å by 10-Å patch in the vicinity of the Tim17 cavity relative to the average thickness of the lipid bilayer (four patches taken remote from the protein complex in the four corners of the maps). Note that membrane thinning occurs independent of membrane potential or asymmetry of the lipid composition.
