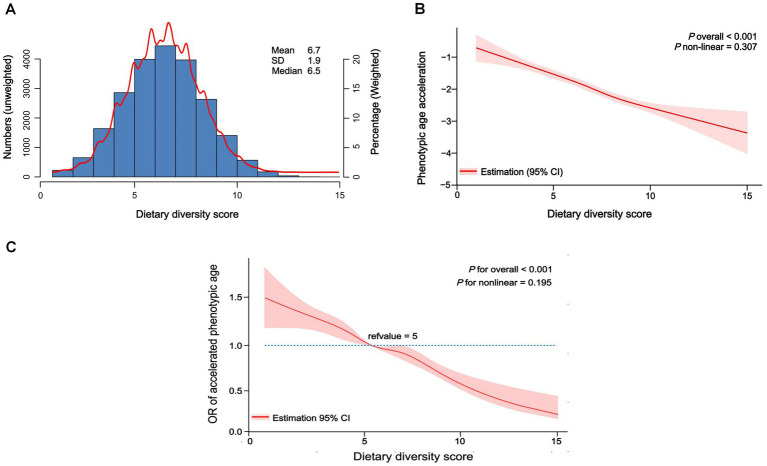
Figure 2.
Distribution of dietary diversity score in participants and restricted cubic spline of dietary diversity score and biological aging. (A) Distribution of dietary diversity score in all participants, unweighted. (B) Restricted cubic spline of dietary diversity score and phenotypic age acceleration, weighted adjusted linear regression. (C) Restricted cubic spline of dietary diversity score and accelerated phenotypic aging, weighted adjusted linear regression.

