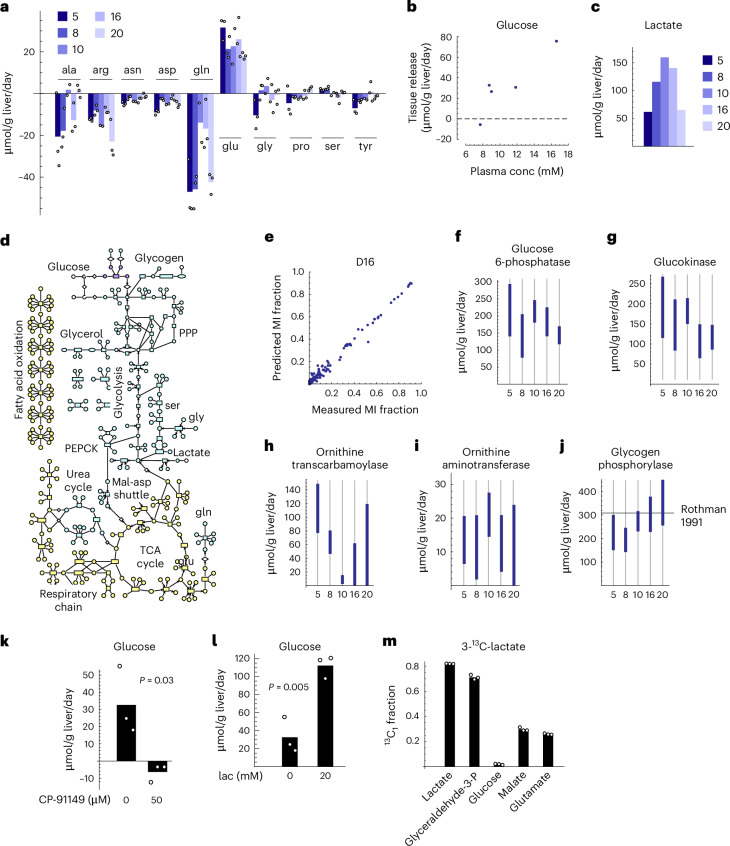
Fig. 4. Metabolic flux analysis in liver tissue.
a, Uptake (negative) and release (positive) fluxes for indicated metabolites from culture medium. Numbers indicate individual donors. b, Glucose release flux versus donor plasma glucose concentration. c, Lactate release flux. d, Schematic of the model used for 13C MFA, with pathways and compartments indicated. Blue, cytosol; red, mitochondrion; green, endoplasmic reticulum. e, Model-predicted versus measured MI fractions for all included metabolites. f–j, 90% confidence intervals for flux through glucose-6-phosphatase (f), glucokinase (g), ornithine transcarbamoylase (h), ornithine aminotransferase (i) and glycogen phosphorylase (j). Solid line in j indicates literature values from source publications listed in Supplementary Table 4. k, Glucose release flux in liver tissue with and without the glycogen phosphorylase inhibitor CP-91149. l, Glucose release flux in liver tissue incubated with indicated concentrations of lactate (lac). m, 13C1 MI fractions of indicated metabolites in liver slices incubated with 20 mM 3-13C-lactate. Confidence intervals in f–j were obtained by the profile likelihood method (Methods) based on n = 3 independent tissue slices. P values were calculated using Student’s two-sided t-test from n = 3 tissue slices.

