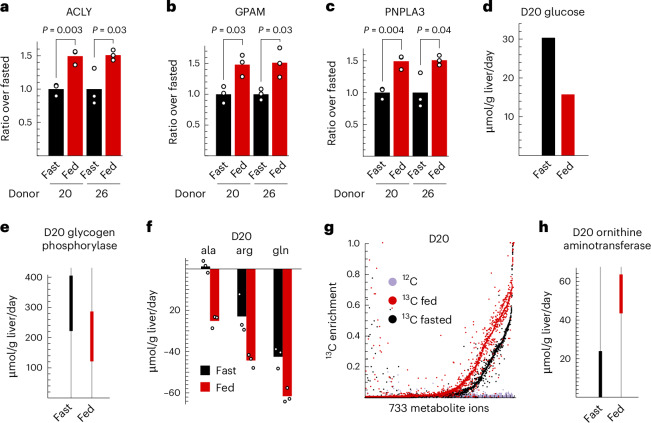
Fig. 5. Metabolic response of liver tissue to nutrients and insulin.
a–c, Expression level of mRNAs for ATP-citrate lyase (ACLY; a), glycerol-3-phosphate acetyltransferase (GPAM; b) and patatin-like phospholipase domain containing 3 (PNPLA3; c) in fasted and fed conditions. d, Glucose release flux. e, 90% confidence intervals for glycogen phosphorylase flux. f, Uptake (negative) fluxes for indicated AAs. g, Distribution of 13C enrichment in the indicated conditions. Dots represent values for individual metabolites, from three tissue slices per condition. h, 90% confidence intervals for ornithine aminotransferase flux. Confidence intervals in e and h were obtained by the profile likelihood method (Methods) based on n = 3 independent tissue slices. P values were calculated using Student’s two-sided t-test from n = 3 tissue slices.

