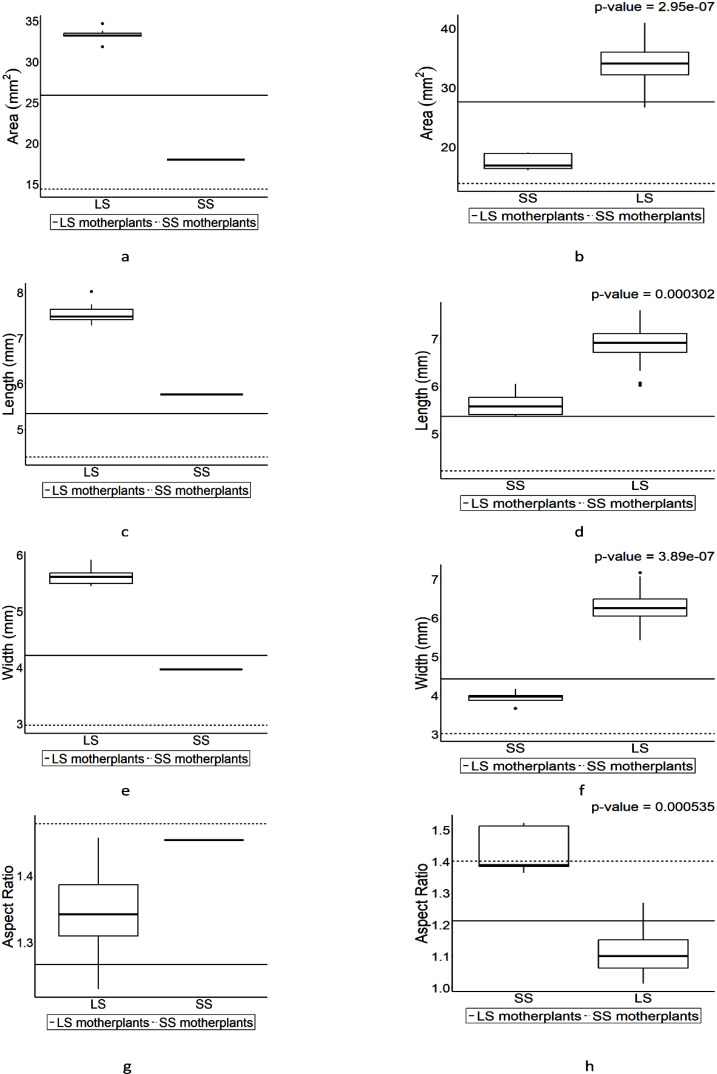
Figure 5.
The boxplot for seed size in F1 progenies which were derived from the crosses of large seed-bearing (LS) and small seed-bearing (SS) individuals. Values above the plot are the results of Wilcoxon rank-sum test. The boxplot on the left side is the pin-type flower, and the boxplot on the right side is the thrum-type flower. Horizontal lines represent parental parameter value of each boxplot. (A) is the area of LS (pin) and SS (thrum). (B) is the area of SS (pin) and LS (thrum). (C) is the length of LS (pin) and SS (thrum). (D) is the length of SS (pin) and LS (thrum). (E) is the width of LS (pin) and SS (thrum). (F) is the width of SS (pin) and LS (thrum). (G) is the aspect ratio of LS (pin) and SS (thrum). (H) is the aspect ratio of SS (pin) and LS (thrum).

