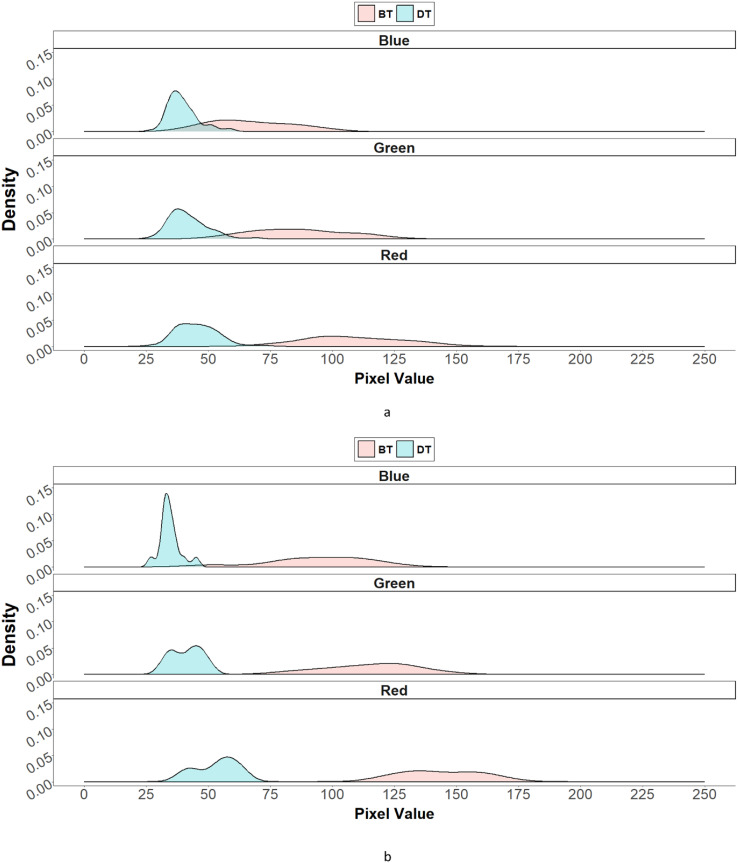
Figure 6.
The distribution density plot of red, green, and blue values based on seed color in F1 progenies, which were derived from the crosses of dark-colored seed-bearing individual (DT) and bright-colored seed-bearing individual (BT) individual. (A) is the RGB distribution density of DT (pin) and BT (thrum). (B) is the RGB distribution density of BT (pin) and DT (thrum).

