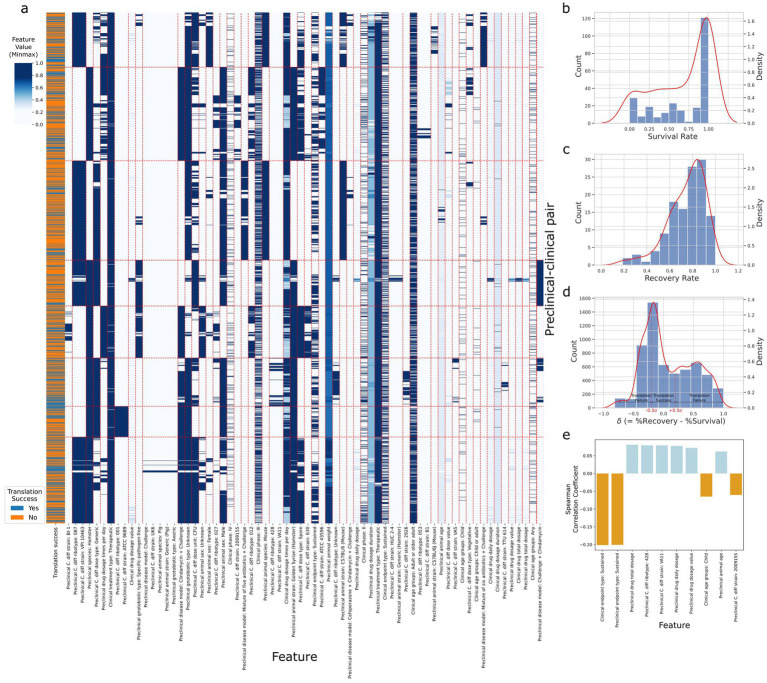
Figure 2.
Statistics of the A2H dataset. (a) The spectral biclustering (Krow = 8 and Kcol = 59) plot of the A2H dataset with . The vertical and horizontal red dashed lines separate column and row clusters, respectively. The features on the x-axis with colons in their names represent categorical features after one-hot encoding, and the string after the colon corresponds to the original category when the encoded feature is 1. The features without colons in their names represent numerical features, and the Min-Max scaling is performed on each numerical feature independently. (b) The distribution of the survival rate from the preclinical trial. (c) The distribution of the recovery rate from the clinical trial. (d) The distribution of delta , the difference between the clinical trial recovery rate and the preclinical trial survival rate. After fitting the normal distribution to the delta, we label the preclinical/clinical trial pairs translation success (label 1) if lies between around, and translation failure (label 0) otherwise. (e) Top 10 features with the highest absolute Spearman correlation coefficients for thresholds , where is the different between clinical recovery and preclinical survival rates, and is the standard deviation of . All the features have adjusted p-value <0.001.

