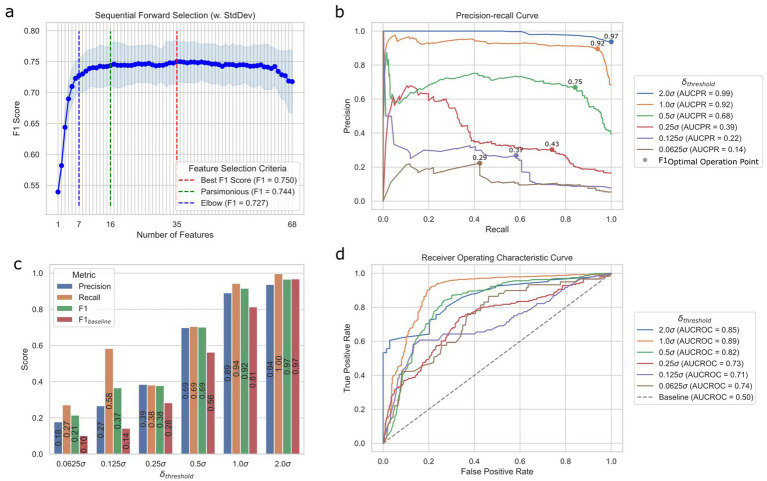
Figure 3.
Prediction performance of the ML translation predictor. (a) Sequential feature selection results for different modes of selection criteria using the validation set. Best is the smallest feature subset when the F1 score was the best, parsimonious is the smallest feature subset that is within one standard error of the cross-validation performance, and elbow is the smallest feature subset based on the Kneedle method. (b) Precision-recall (PR) curves of different cutoff thresholds on the test set. F1OOP denotes the optimal operating point chosen based on the best F1 score. The values above the dots indicate the F1 scores of OOPs. AUCPR stands for the area under the PR curve. (c) Performance metrics of different datasets created with different cutoff thresholds on the test set. (d) Receiver operating characteristic (ROC) curves of different cutoff thresholds based on the test set. AUCROC stands for the area under the ROC curve.

