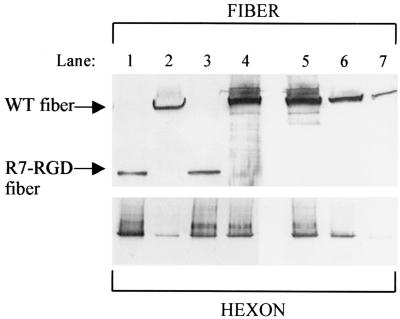
FIG. 6.
Protein analysis of virus particles purified by ultracentrifugation in CsCl gradient. Virus samples from CsCl gradient fractions were analyzed by SDS-PAGE, and viral proteins were electrically transferred to nitrocellulose membranes. Blots were reacted with antifiber (4D2.5; upper panel) or antihexon (2Hx2; lower panel) antibody. Lane 1, Ad5/FibR7-RGD (5 × 10⁵ PFU); lane 2, Ad5/FibWT (5 × 10⁵ PFU); lane 3, Ad5/FibR7-RGD (5 × 10⁵ PFU); lane 4, Ad5/FibWT (1 × 10⁷ PFU); lanes 5 to 7, Ad5/FibWT at 107, 106, and 105 PFU, respectively. Note that lanes 1 and 2 had equal loads of infectious particles (PFU, as counted on 293 cells), while virus loads in lanes 3 and 4 had been normalized to equal numbers of physical particles, based on the hexon protein content (see the hexon signal in the lower panel).

