Fig. 1.
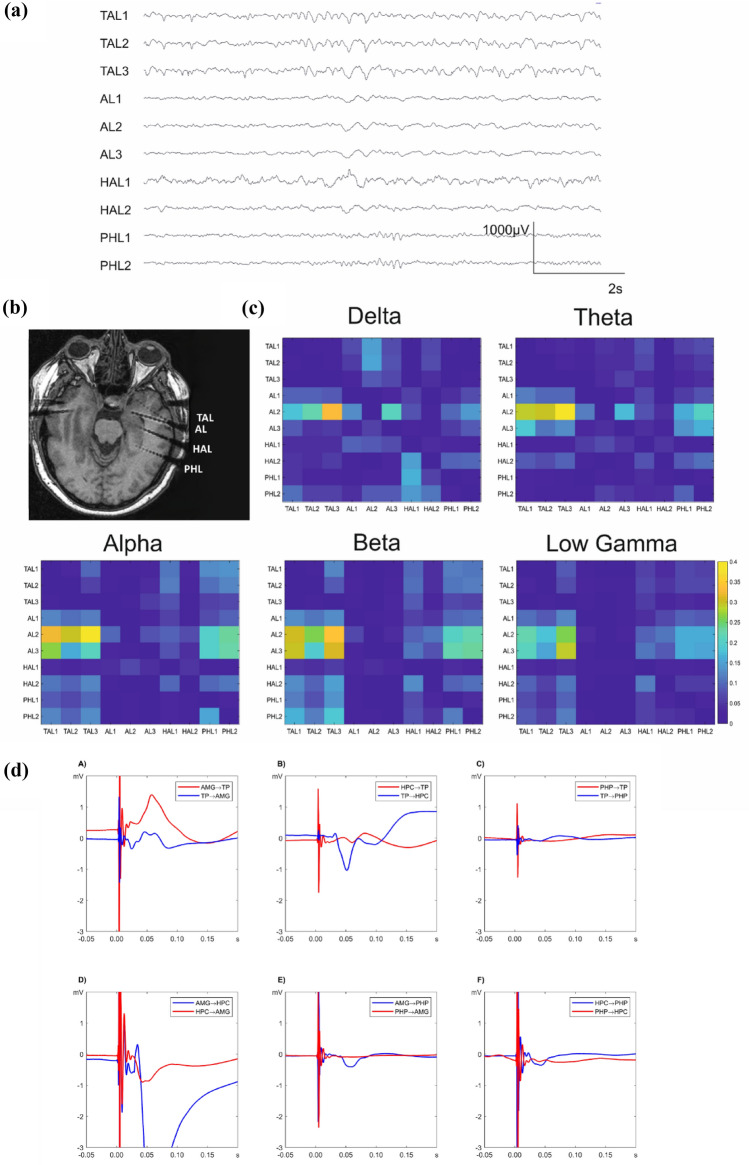
Exemplary data of one representative patient (Pt. 6). a An intracranial EEG interictal sample with spontaneous neural activity selected for the Granger Causality analysis. The channel names indicate the electrode placement: TAL temporal pole left, AL amygdala left, HAL hippocampus left, PHL parahippocampal gyrus left. The smallest contact number corresponds with the most mesial localization. b Postimplantation T1 MRI scan showing a typical placement of the depth electrodes in the left mesial and anterior temporal lobe. c Connectivity matrices for the investigated frequency bands based on Granger causality analysis. The source and the target of the Granger causality index are assigned to the y- and x-axis respectively, the matrix labels correspond with the channel names of the depth electrodes. For all frequency bands, high functional connectivity directed from amygdala to the temporal pole and the parahippocampal gyrus is evident, although a decrease in connectivity in slower frequencies is noticeable. d Averaged early SPES responses for the six regional pairs arranged according to the source and target of electrical stimulation in a bidirectional way. Asymmetry in bidirectional connectivity is especially noticeable for amygdala and hippocampus (subplot D) as well as hippocampus and temporal pole (subplot B). HPC: hippocampus, AMG amygdala, TP temporal pole, PHP parahippocampal gyrus

