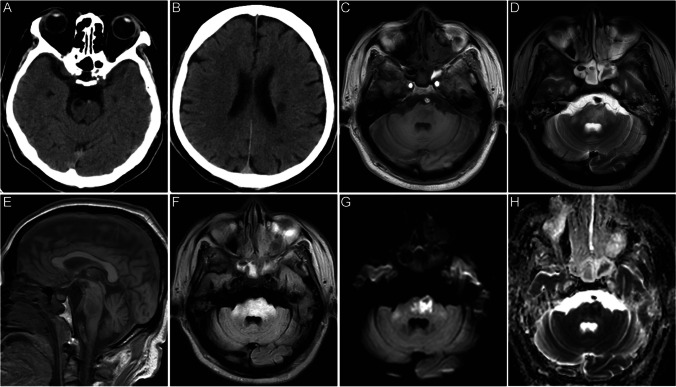
Fig. 1.
Neuroimaging findings in DQ-induced toxic encephalopathy. A head CT scan showed patchy low-density shadows on the right side of the brainstem (A) and near the left ventricle (B). Multiple patchy long T1 (C) and long T2 (D) signals in the right frontal lobe, bilateral paraventricular, bilateral basal ganglia, brainstem, and right cerebellum. Large low-signal shadows in the T1W sagittal position (F) pons. FLAIR mostly showed high signal (F). DWI (G) brainstem lesions showed significantly high signal, and ADC (H) showed low signal

