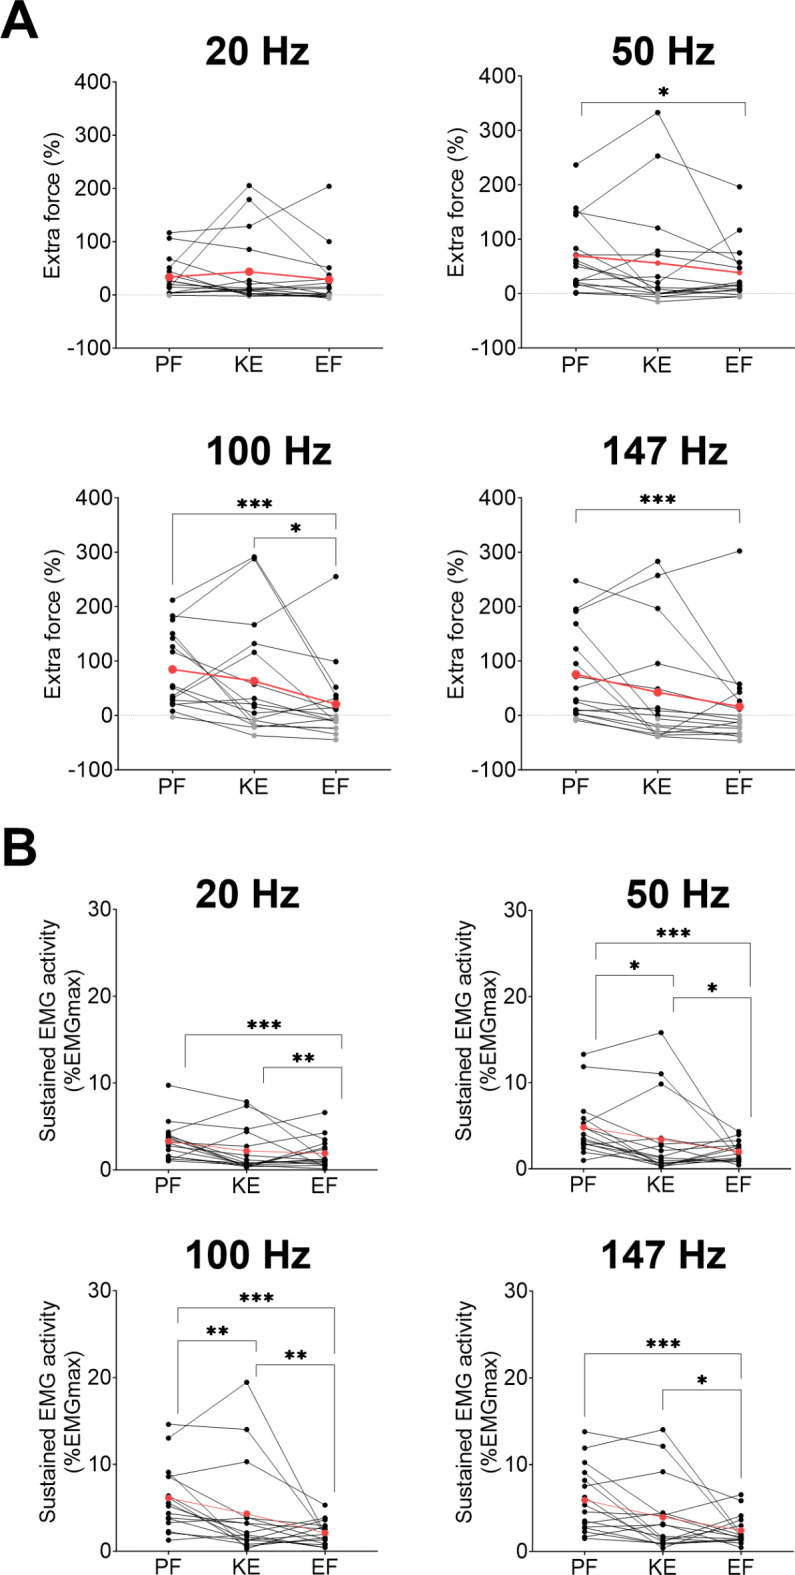
Fig. 4.

Comparison of extra force (A) and sustained electromyographic (EMG) activity (B) between muscle groups (PF: plantar flexors; KE: knee extensors; EF: elbow flexors) at each stimulation frequency. Individual and mean data (red) are displayed. For extra force, positive values representing responders are in black while negative values corresponding to non-responders are in grey. EMG activity was measured on soleus for plantar flexors, vastus lateralis for knee extensors and biceps brachii for elbow flexors. *p < 0.05, **p < 0.01, ***p < 0.001.
