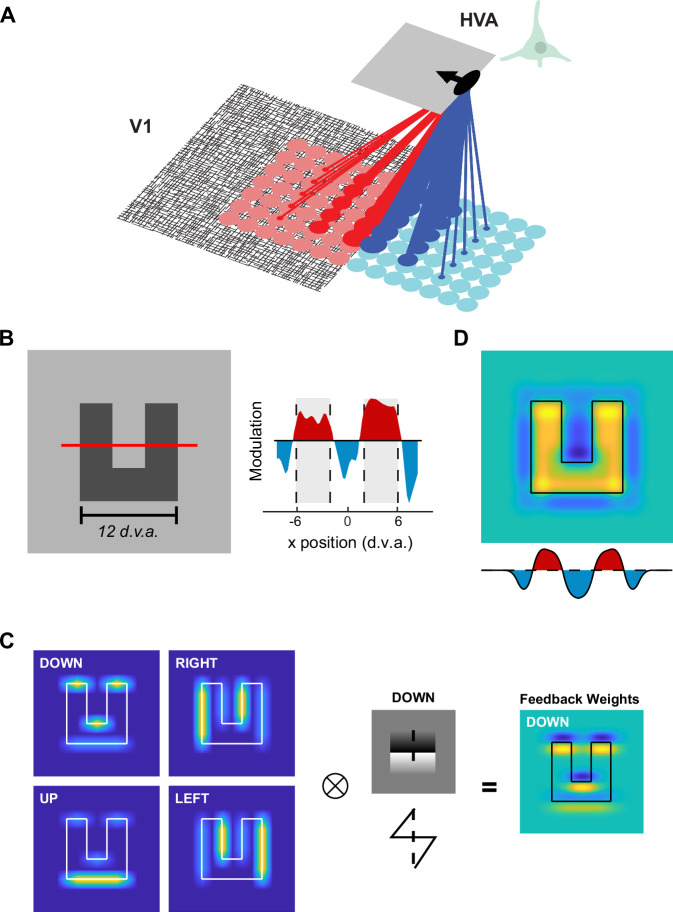
Fig. 1. Feedback from border-ownership neurons can explain patterns of figure-background modulation observed in V1.
A The proposed logic of the feedback connections. An example BO-tuned cell in a higher visual area (HVA; e.g. V2, V3 or V4) is depicted which prefers a figure located to the left of its RF (indicated by the black arrow). We hypothesized that the cell sends excitatory feedback back to V1 in the direction of its preferred side-of-ownership (red lines) and inhibitory feedback in the non-preferred direction (blue lines). The strength of the feedback is depicted as the thickness of the lines, with the strongest feedback to V1 cells with RFs that are nearby and aligned with the RF of the HVA cell. B Left, In a previous study7 of FBM in V1 in response to complex shapes, we used texture-defined ‘n’ and ‘u’ shaped objects. We measured the V1 response along a cross-section depicted by the red line. Right, V1 activity elicited by the figure was enhanced (red regions and gray shading) and that elicited by the background was suppressed (blue regions). The scale bar is 12 degrees of visual angle d.v.a. C Left, The modelled activity of four sub-populations of HVA cells with different side-of-ownership preferences (warmer colors = higher activity). Border-ownership modulated the orientation-tuned responses of the model cells, e.g. HVA neurons tuned to ‘Down’ preferred horizontal borders and their activity was stronger if the figure was situated downwards relative to the RF. We convolved the activity pattern of each HVA sub-population with its connectivity kernel (black-white pattern illustrates the kernel of the ‘Down’ preferring population) with a ‘saw-tooth’ shape (cross-section shows the kernel) representing the weights of feedback connections to V1. Right, Influence of the ‘Down’ preferring population on V1 activity. D The overall feedback influence on V1 summed across the four HVA sub-populations. Yellow and blue colors indicate positively and negatively modulated V1 responses, respectively (arbitrary units). The graph underneath shows a cross-section through the model’s V1 activity profile (red line in B). Note the similarity to the spatial profile of V1 activity in (B).

