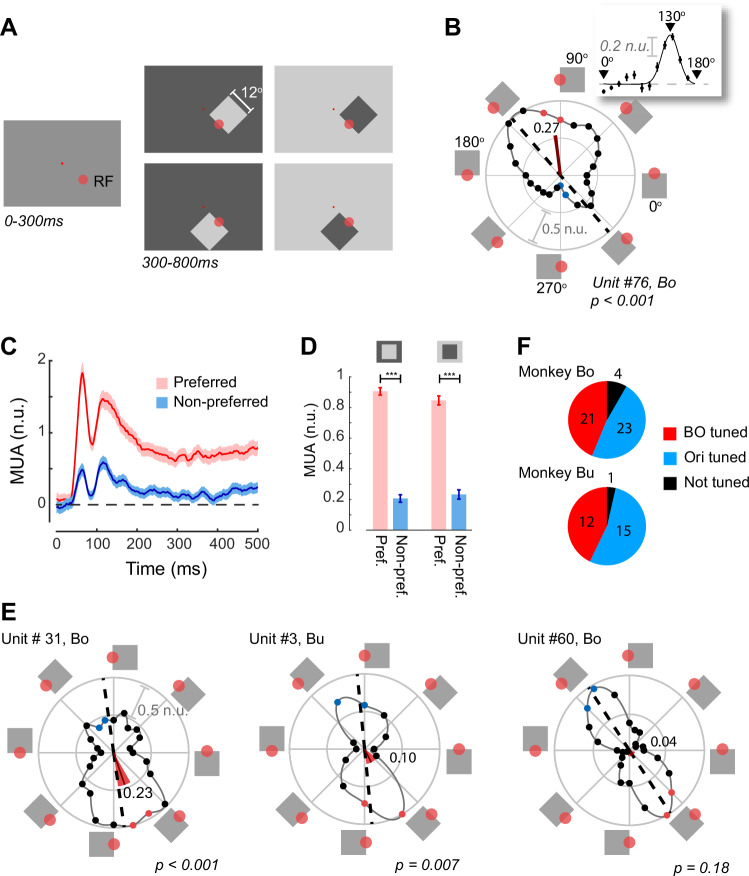
Fig. 2. Border-ownership tuning in V4.
A The stimuli used to measure BO-tuning. The monkey fixated on the small red fixation dot throughout the trial. The larger red circle indicates the approximate size of the V4 RF (not visible to the monkey). Luminance-defined squares were shown at one of 12 or 24 orientations and one of two luminances (dark or light grey) on a background with the opposite luminance. B Normalized responses at an example recording site, n = 38 (min) to 45 (max) trials per border-orientation. The squares around the edge of the plot depict the position of the figure relative to the RF. 0° is the condition in which the RF is situated on the upper border of the square. The solid line shows a polynomial fit to the data. The dashed black line indicates the fitted preferred orientation. The angle of the red line indicates the preferred border-ownership BOpref. Its length represents 1-CircVar, which is a measure of border-ownership strength (here 0.27) and the width of the red-segment indicates the 95% confidence interval of BOpref (here 6°). The filled red and blue dots indicate the border-orientations closest (red) and furthest (blue) from BOpref used to test border-ownership. Scale bar, 0.5 normalized units (n.u.). Inset, orientation tuning, calculated by combining responses across borders with the same orientation. The fitted curve is a circular Gaussian. Error bars, s.e.m. across trials. C Time course of MUA activity at the site of panel B, elicited by a border with the preferred (red) and non-preferred ownership (blue) (borders correspond to colored dots in B). Shaded regions, ± s.e.m. D Average activity at the example recording site in B and C, in a time-window from 0 to 500 ms, for the two contrast polarities. Error-bars, s.e.m. ***p < 0.001 (weighted t-test). E Activity at three other recording sites. The leftmost two example recording sites were significantly BO-tuned (weighted t-test at the red/blue border-orientations), whereas the site at the right was orientation-tuned (p < 0.001), but not BO-tuned. Conventions as in B. F Pie-charts showing the number of BO-tuned, orientation-tuned (and not BO-tuned) and non-tuned recording sites in the two monkeys. Source data are provided as a Source Data file.

