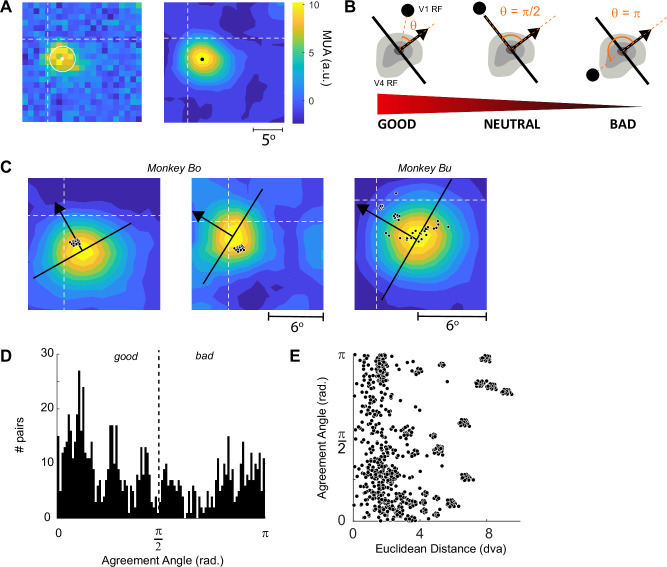
Fig. 3. Agreement angle, θBO.
A V4 RFs were estimated using a grid of luminance -defined square stimuli. Left, The response of neurons at a typical V4 recording site. Dashed lines: horizontal and vertical meridians. White dot and circle, center position and standard deviation of the best-fitting 2D Gaussian. Right, Contour-fit to the same data. The black dot indicates the center-of-mass of the highest-level contour and was our estimate of the center of the RF (see Methods). B The agreement angle (θ, orange segment) is the angle in radians between the line of preferred figure-location of the V4 neurons (black arrow) and the position of the V1 RF (black dot). Low values of θ indicate that the V1–V4 pair are in good agreement and high values indicate bad agreement. C Contour-maps from three example V4 sites, the preferred figure-location is shown by the black arrow. Black dots, centers of V1 RFs. The leftmost example shows a V4 cell that is in good agreement with all V1 sites, the middle example shows only bad agreement pairs and the rightmost shows an example from monkey Bu (for which we could include more V1 arrays) with a variety of agreement values. D The distribution of agreement angle across all V1–V4 pairs in monkeys Bo and Bu. E The joint distribution of agreement angle and the distance between the RF centers of all V1–V4 pairs in these two monkeys in degrees of visual angle (dva). The clustering of the data arises because V1 units recorded from the same Utah array have clustered RFs. Source data are provided as a Source Data file.

