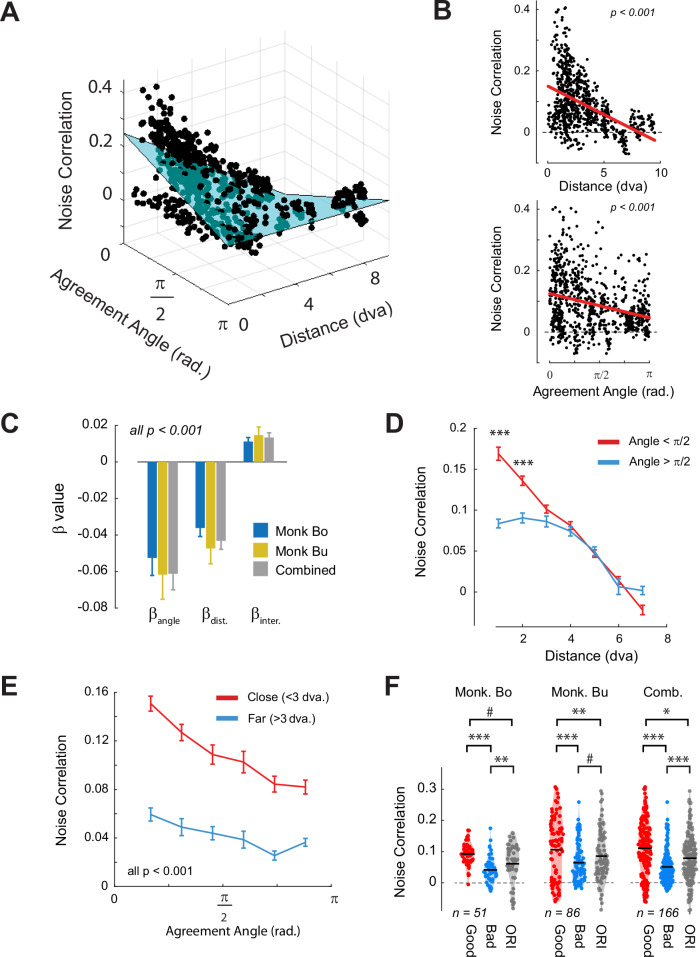
Fig. 4. Noise correlations depend on agreement angle and the distance between RFs.
A Results from a general linear model in which the strength of V1–V4 noise correlations (z-axis) were predicted from the agreement angle (x-axis), the distance between the RF centers (y-axis) and their interaction. The best-fitting regression surface is depicted in blue. A video showing rotation of this graph is shown in Supplementary Video 1. B The marginal distributions for distance (upper) and agreement angle (lower). The red line shows a linear regression on the marginal distribution. C The best-fitting beta coefficients for each animal separately and the combined data. D Noise-correlations for good (< π/2, red) and bad (> π/2, blue) agreement angle, binned according to the RF distance. *** = p < 0.001, independent samples t-test with Bonferroni correction. E Noise-correlations for V1–V4 pairs with nearby (< 3 dva, red) and far (> 3 dva, blue) RFs, binned according to agreement angle. All comparisons were significant at the p < 0.001 corrected level. F The average noise correlations for nearby pairs separated into good, bad agreement and for V4 sites that were tuned to orientation but not to BO. The black lines indicate the means of the populations. The n value indicates the number of V1–V4 pairs after stratification to equalize the RF distance between populations. Error-bars in C–E denote s.e.m. ***:p < 0.001, **:p < 0.01, *:p < 0.05, #:p < 0.1 independent samples t-test. Source data are provided as a Source Data file.

