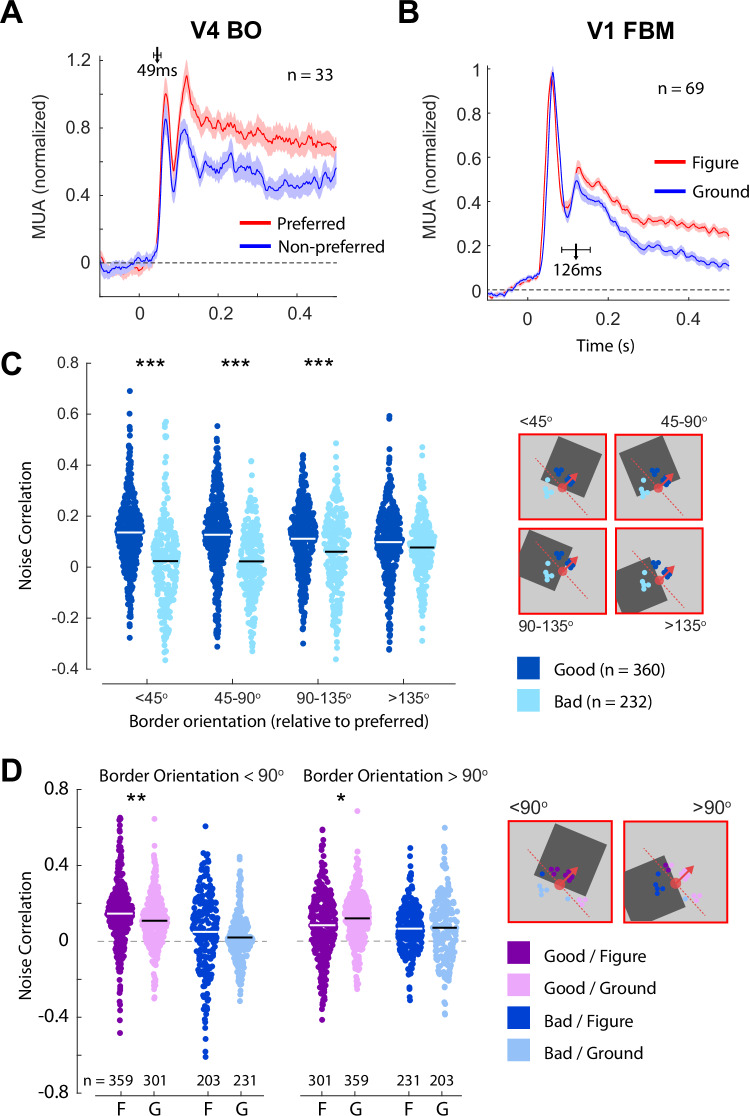
Fig. 5. Noise correlations between neurons in V1 and V4 during responses to visual stimuli.
A Mean responses across 33 BO-tuned V4 recording sites elicited by their preferred and non-preferred border-orientations. The shaded region is ±1 s.e.m. The arrow marks the estimated latency of BO modulation, error-bars indicate the 95% confidence interval. B Mean response across 69 V1 recording sites to the luminance-defined squares used to determine BO-tuning. We sorted trials according to whether the RF fell on the square figure (red) or on the background (blue). The shaded region is ± 1 s.e.m. The arrow marks the estimated latency of FBM, error-bars indicate the 95% confidence interval. C Noise correlations between V4 and V1 recording sites in the sustained period of firing (100–500 ms). Correlations were calculated separately for pairs in good (dark blue) or bad (light blue) agreement in bins reflecting the difference in the orientation of the border inside the V4 RF relative to the preferred border-orientation. The white/black lines indicate the means of the distributions. The inset on the right shows the preferred border-orientation (red-dashed line) and preferred figure-location (red arrow) of a V4 recording site, example figure locations, and V1 recording sites that were in good (dark blue) and bad (light blue) agreement. *** = p < 0.001, ** = p < 0.01 independent samples t-test, Bonferroni corrected. Error-bars are ±1 sem. D Noise-correlations in the sustained period split according to whether the V4 neurons responded to their preferred border or not, the agreement angle of the V4–V1 pair and whether the V1 RF fell on the figure or the background. ** = p < 0.01, * = p < 0.05 paired t-test, Bonferroni corrected. Source data are provided as a Source Data file.

