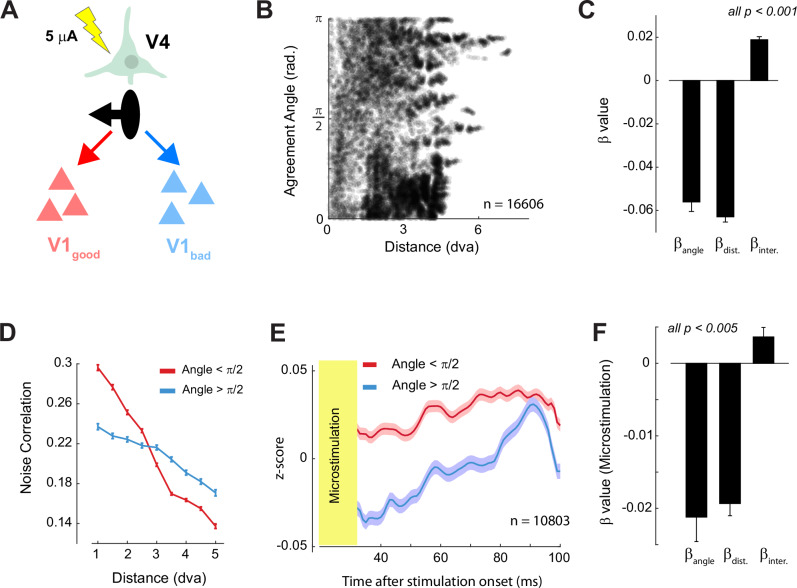
Fig. 6. Micro-stimulation of V4 drives V1 responses in accordance to the Agreement Angle.
A We used micro-stimulation to activate neurons at individual V4 recording sites. The pictured V4 site prefers figures to the left of its RF (black arrow). We hypothesized that weak V4 stimulation would cause increased activity in V1 sites with RFs situated to the left of the V4 cell’s RF (red cells, good agreement) compared to sites in bad agreement (blue cells). B Distribution of agreement angle and RF distance of V1–V4 pairs in monkey N. C Beta coefficients a linear model relating noise correlations to agreement angle and RF distance in monkey N (conventions as in Fig. 4C). D The V1–V4 noise correlation in monkey N as function of RF distance for good (red) and bad agreement pairs (blue). Comparisons were significant in every RF-distance bin (p < 0.05, independent samples t-test with Bonferroni correction). Error bars indicate ± 1 s.e.m. E Average responses in V1 aligned on the onset of micro-stimulation in V4. V1 sites were split into sites that were in good (red) and bad (blue) agreement with the stimulated V4 site. The shaded region indicates ± 1 s.e.m. F Beta coefficients from a linear model, identical to that in panel C, except that the V1 MUA response after micro-stimulation (35−100 ms) was the dependent variable. Error-bars indicate ±Source data are provided as a Source Data file.

