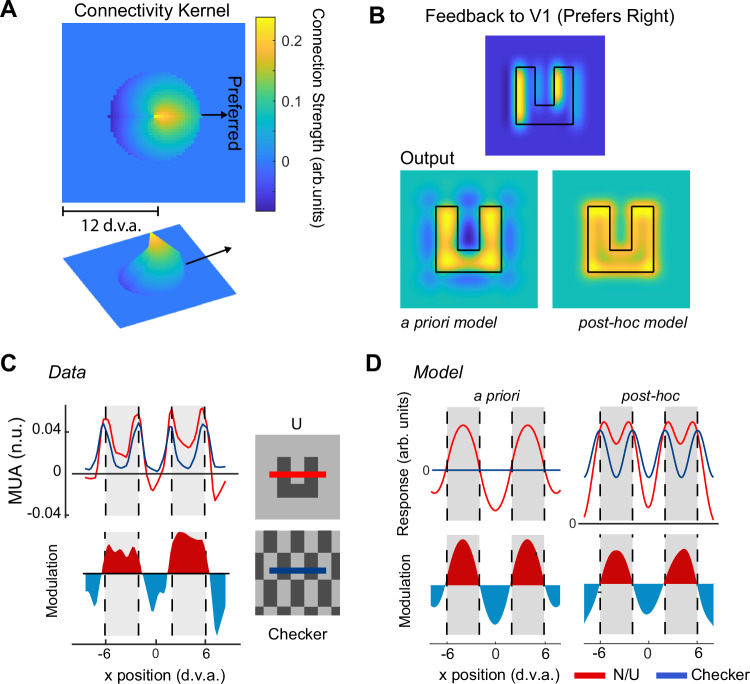
Fig. 7. Refined model of figure-background modulation.
A We revised the a priori model from Fig. 1 by using the best-fitting regression plane shown in Fig. 4A as the connectivity matrix between V4 and V1, which is shown in 2 and 3 dimensions. The preferred figure-location for this example kernel is to the right. Other preferences were achieved by rotating the kernel. B upper panel, The overall feedback signal to V1 from V4 units preferring surfaces to the right obtained by convolving the kernel with a ‘u’ shaped figure. Lower panels, predictions of V1 activity for the a priori and post hoc model (using the kernel of A). C Neuronal data in area V1 of monkeys elicited by a textured-defined ‘u’ shape (red trace) and checkerboard pattern (blue trace) along a cross-section indicated by the red/blue line of the inset (from Self et al.7). The lower panel shows the difference between the conditions (identical to Fig. 1B). Red regions are regions with V1 excitation, blue regions signal V1 inhibition. D left, V1 activity according to the a priori model. Note that this dataset was not used to fit the refined model.

