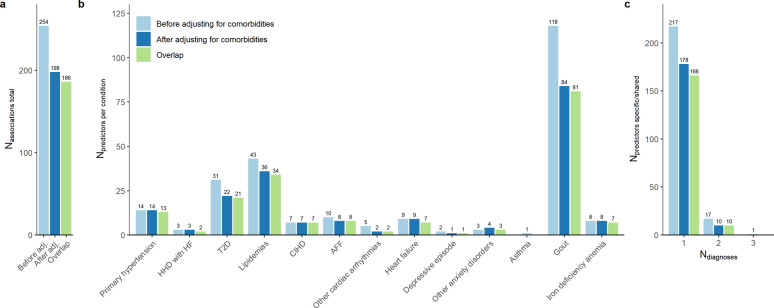
Fig. 4.
Comparison of results from primary and comorbidity-adjusted analyses. A comparison of results of primary analysis (before adjusting for comorbidities, black) and secondary analysis (after adjusting for comorbidities, dark gray). Light gray highlights the overlap of significant associations/predictors between the two approaches. a Total number of associations. b Number of predictors across evaluated conditions. c Number of condition-specific (Ndiagnoses = 1) and shared predictors (Ndiagnoses > 1). AFF—atrial fibrillation and flutter, HHD with HF—hypertensive heart disease with heart failure, CIHD—chronic ischemic heart disease, T2D—type 2 diabetes. Cox models for primary analysis were adjusted for age, body mass index, sex, smoking status. Cox models for sensitivity analysis were further adjusted by the first two principal components calculated from Hamming distances between comorbidity profiles.

