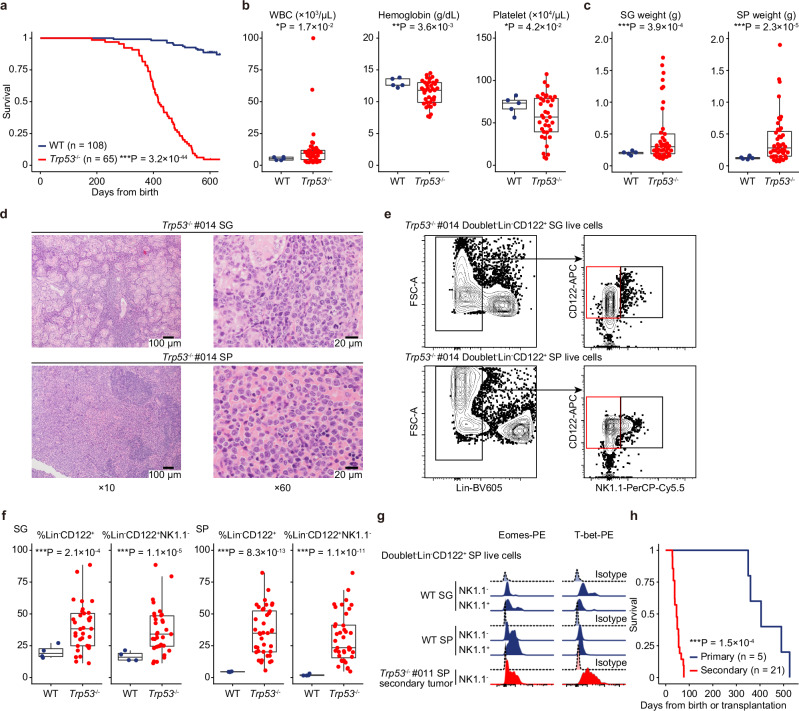
Fig. 1. Targeted disruption of Trp53 causes NK-cell lymphomas after long latency.
a Kaplan–Meier survival curves of WT (n = 108) and Trp53−/− (n = 65) mice. Log-rank test. b CBC in PB of WT (n = 5 at 60 weeks old) and Trp53−/− (n = 37 at tumor onset) mice. c SG and SP weights of WT (n = 5 at 60 weeks old) and Trp53−/− (n = 41 at tumor onset) mice. d Representative images of hematoxylin and eosin staining of Trp53−/− tumors in SG and SP. e Representative plots of immature NK cells (Lin−CD122+NK1.1−) in Trp53−/− tumors in SG and SP. f Proportion of Lin−CD122+, and Lin−CD122+NK1.1− cells in SG (n = 4) and SP (n = 4) from WT (at 60 weeks old) and in SG (n = 33) and SP (n = 40) from Trp53−/− (at tumor onset) mice. g Representative histograms of Eomes and T-bet expression in Lin−CD122+NK1.1− and Lin−CD122+NK1.1+ cells in SG and SP from WT mice (at 8 weeks old) and Trp53−/− secondary tumors in SP. Isotype controls are shown as shaded histograms. h Kaplan–Meier survival curves of secondary mice (n = 21) transplanted with 1 × 10⁶ Trp53−/− tumor cells compared with the corresponding primary mice. (n = 5). Log-rank test. b, c, and f Box plots show medians (lines), IQRs (boxes), and ±1.5× IQR (whiskers). *P < 0.05, **P < 0.005, ***P < 0.0005, two-sided Welch’s t-test. a, b, c, f, and h Source data are provided as a Source Data file.

